Roger Merz and Thomas Schaffner of Vontobel Asset Management look at the outlook for active investors in China’s equity markets,...


June 1, 2022
Report

|
Written By: Martha Brindle |

|
Weichen Ding |
Martha Brindle and Weichen Ding of bfinance describe the different categories of equity management and consider the various factors affecting their performance
Factors are back in focus, with many allocators reconsidering their exposure to well-established equity styles in light of pandemic-era performance. Investors may wonder: does Low Volatility still have a place in portfolios, based on an examination of 2020 – its annus horribilis? Has the major style rotation from Growth to Value, which has been particularly evident in early-2021, vindicated those who maintained diversification? How should investors assess their approach to ESG, given its associated tilts towards Growth and Quality?
Amid this period of evaluation, it is particularly helpful to consider not just the performance of well-recognised style indices, whose figures are often discussed, but the results obtained by active managers with a strong adherence to those styles.
As such, this article first takes a look at the returns generated by these active “style managers” using composites specifically developed for performance-tracking purposes. This introductory overview is followed by a closer look at the Low Volatility space, with an examination of the broader universe of Low Vol managers. This highlights not just overall results, with the average manager beating the relevant factor-based indices, but the considerable performance dispersion among managers. Deeper examination reveals the different ways in which portfolios are constructed and managed. Better understanding of these variations – in Low Vol and other styles – can help investors to gain clarity not just on whether to maintain exposure to certain factors but on how best to implement those exposures.
Style manager returns – the long view
All active equity managers’ returns can be attributed, to a significant degree, to the performance of various factors or styles. Many investors now engage in style-based decomposition of active manager returns “as standard”.
However, there exists within the active manager universe a significant proportion of managers that are very closely and consistently engaged with one or two styles – be they “value” or “income” or “quality plus growth”. Not all of these styles are associated with recognised risk premia. Not all of these managers “self-label” under the style that appears to define their approach, although many do. Many of these groups include both quantitative strategies and discretionary strategies. A significant number of them can be broken down into sub-groups: Value managers, for example, can be understood somewhat better if we divide the group into “Value” and “Deep Value”, or even more granular sub-categories.
Understanding the performance of these style managers can be helpful for a number of reasons. Firstly, while there are evident connections between their results and the results of indices that may bear the same label, there can also be notable differences. This extra lens can help to illustrate, for example, whether underperformance stems from a factor, a way of defining a factor (especially where many different definitions exist – Value being a case in point) or a way of implementing a portfolio that is oriented around that factor. Performance dispersion among active managers can provide further clarity around those questions. Secondly, certain style families do not have a “smart beta” cousin and should be analysed in an active management context. Thirdly, style manager families can provide useful comparators with which to assess the performance of one’s own managers.
Figure 1 illustrates active manager performance using a selection of composites – each one comprising a selected group of asset managers that we view as being highly representative of the particular style. While 2021 has brought a dramatic reversal of fortunes for the Equity Value factor, which is reflected in the performance of “Value” and “Deep Value” managers, we see that the run has not been enough to overturn the dominance of “Growth”, “High Growth”, “Quality Growth” and “Quality” managers over the last three, five and 10 years.
Figure 1: Relative performance of active global equity managers (Developed Markets) vs MSCI World, to 31st March, 2021
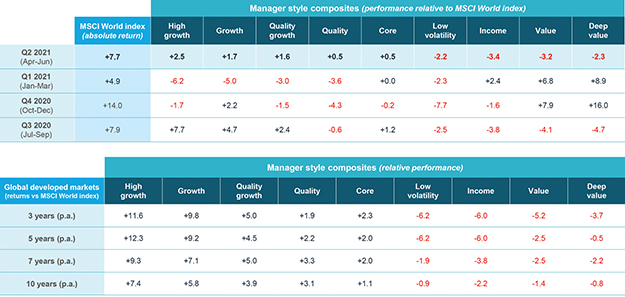
Style classifications assigned by bfinance. Returns in USD, gross of fees. Sources: eVestment, Style Analytics, bfinance
This long-term environment has presented a headwind to the Value manager universe, leading to significant outflows from some strategies, a number of high profile manager wind-downs and, in cases, a strategic reinterpretation of Value by managers themselves as they have sought to adjust to stabilise their businesses. We have recently seen an uptick in investor appetite for managers focusing on this style, especially for managers who have been very consistent with their approach despite the difficulties of recent years.
Although our ESG equity manager composite is not shown here, since we do not consider this to be a mutually exclusive style grouping alongside the other families, we should note that the early part of 2021 has proven to be more challenging for this cohort. This is in part because the tailwinds that supported these strategies in 2020 – strong association with Quality and Growth, low association with Value, lower exposure to Energy – have been less beneficial this year.
Style under scrutiny: low volatility
The Low Volatility factor has delivered particularly disappointing results during the Covid-19 era. Until the pandemic, this academically-supported risk premium had provided at least some resilience in virtually every market downturn in recent memory. The MSCI World Minimum Volatility Index returned just 2.6% in 2020, versus the MSCI World Index’s 15.9%. Low Vol’s troubles have extended into 2021.
Figure 2: Crisis protection? Relative performance of factor indices vs MSCI World during downturns
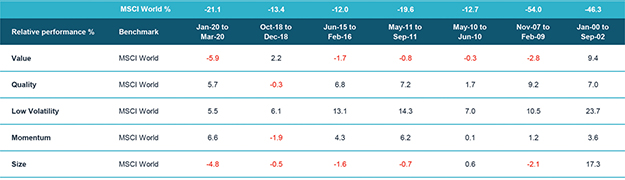
Source: Bloomberg, bfinance. Indices: MSCI World Value Index, MSCI World Quality Index, MSCI World Minimum Volatility Index, MSCI World Momentum Index, MSCI World Equal Weighted Index
The explanation behind recent poor performance is two-fold: the factor provided weaker protection during the March 2020 downturn in global equities than it had given during previous crashes, then lagged through the market’s subsequent gravity-defying bull run. While the latter is typical, the former was decidedly unexpected. The Covid-induced crash was, after all, one that turned conventional wisdom about downturns on its head, with technology (typically a more cyclical sector) showing the only real immunity while defensive sectors such as utilities fell victim to the sell-off. Between the unusual sector performance and a very wide sell-off (which produced beta compression), the Low Volatility factor – and with it an extended family of index and ETF products – came unstuck.
Yet what of active managers – who, after all, do not typically seek to provide as much volatility reduction as min-vol indices? The picture is extremely mixed: some managers differentiated themselves through portfolio construction, sector positioning and the level of volatility reduction being targeted. There are now more than 60 active global equity strategies available with an explicit low-vol angle, of which 50 have a track record of more than five years. Among them, the median performer in 2020 (+3.8%) came out only 1.2% ahead of the MSCI World Minimum Volatility Index and still 12.1% behind the MSCI World Index, while the top performers still lagged MSCI World but beat the Min Vol index by nearly 12%. Those stronger performers also tended to have more sector-neutral approaches, less extreme volatility-reduction targets (strategies with 15-25% volatility reduction outperformed those with >35% volatility reduction) and less exposure to the Value factor.
How has the recent period affected longer-term results? Five-year risk/return data shows that active managers have delivered volatility reduction of 10-40%. Average performance has been disappointing overall, notwithstanding wide dispersion between the stronger and weaker managers. Few strategies have succeeded in beating the MSCI World Index over the past five years – in large part due to the events of 2020 – and only around half of them have beaten the MSCI World Minimum Volatility Index over this time horizon.
Figure 3: Five-year annualised performance of Low Volatility global equity managers
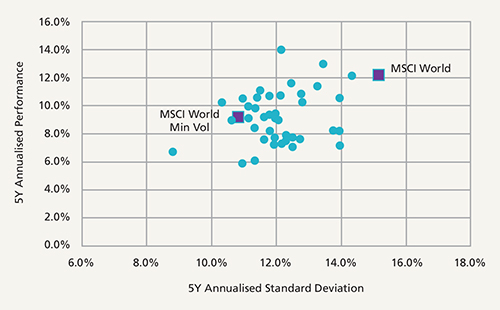
Source: eVestment, bfinance. Data at 31/12/2020, in USD, gross of fees
Key drivers of dispersion among Low Vol managers include:
Recent troubles will undoubtedly have a significant and lasting effect on client demand for low-volatility strategies; this shift is already evident in bfinance’s own manager search figures. Yet, for investors who are generally concerned about equity market drawdowns caused by economic slowdowns (as opposed to those created by pandemic-related lockdowns), Low Volatility still has a significant potential contribution to make in terms of reducing overall risk exposure. Key differences between the 2020 crash and those that preceded it – or those that may follow – need to be kept in mind.
Investors who still believe in the potential advantages of Low Vol should, however, use the lessons of 2020 to reflect on the different ways in which these strategies can be approached: active versus passive, the level of volatility reduction targeted, neutrality or flexibility in sector exposures, top-down optimisation versus bottom-up factor-based construction, and so forth. It is also important for investors not to look at the Low Vol question in isolation but to consider their portfolio’s overall exposure to all factors that have been established as academically significant. Investors may also want to think about the interplay between factor exposures, such as the role of Quality (low fundamental risk) alongside Low Volatility (low statistical risk).
When reflecting on Low Vol – and indeed on the broader performance data shown above for managers spanning a range of factors and styles – it is always essential to remember that any of them can underperform in the short-, medium- or even not-so-medium term. Investors must consider how they handle such phases and ensure that lack of institutional tolerance for difficult periods doesn’t undermine a proposed long-term vision. However, a close eye on optimising the implementation approach and understanding the drivers of results can help to maintain coherence and confidence in the overall strategy.
|
|
|