Beyond borders and books

|
Written By: Stephen Way |
EVA uncovers economic realities, not just accounting conventions. Stephen Way of AGF outlines how economic value-add can help identify investment opportunities
The global economy has undergone a profound transformation in the wake of the 2008 financial crisis as weak economic growth continues to challenge investors. While many companies have been hard hit by the crisis, some firms have been proactive about managing costs and crafting a sustainable business model. They’ve been able to thrive at a time when profitability has eluded many. More than ever before, active managers must focus on metrics that will allow them to identify companies that can effectively control costs, deploy capital and create value for shareholders. An economic value-add (EVA) approach is a critical tool for finding those companies that are working their assets harder and maintaining profitability in this challenging global environment. EVA metrics extend across borders, going beyond traditional accounting measures and uncovering the economic reality behind the books.
Minding the GAAP
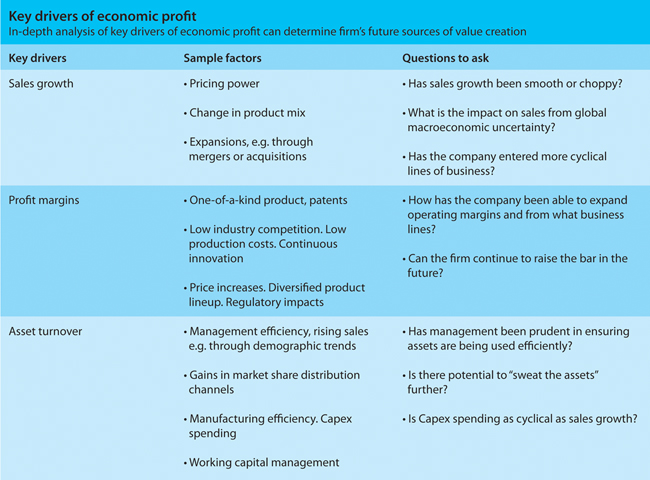
All bottom-up financial analysis relies heavily on financial statements and accounting data. One of the key drivers of an EVA-based approach stems from the limitations of Generally Accepted Accounting Principles (GAAP). GAAP measures tend not to capture the economic realities and underlying business dynamics that are fundamental to sustainable value creation. Moreover, in a global context, GAAP doesn’t reveal the nuances between regions and countries including important macro factors such as varying inflation rates. An EVA approach helps normalise the shortcomings of GAAP by focusing on key drivers of economic profit – sales growth, operating margins and asset turnover. These factors cut across borders and are universally critical to determining how a company will perform in the future. It can also be used as a tool to help determine if a franchise is sustainable.
For example, capital investment is just one area where GAAP falls short when it comes to seeing whether or not a company’s investment will benefit it in the long term. GAAP requires firms to expense research and development (R&D) costs in the year made, but that doesn’t show the whole picture from an economic standpoint because all cash outlays that are expected to contribute to future earnings should be considered capital investment.
Instead, R&D costs should be capitalised on the balance sheet and then amortised over time because they represent an investment in future products or processes that will generate potential earnings down the road. Expensing R&D instead of capitalising it leads to crucial differences on the same balance sheet: it distorts ratios such as return on investment and may also show a high return on capital when that clearly isn’t the case.
Management teams quite often focus on earnings accretion rather than value accretion. EVA focuses on metrics that help investors truly understand the economic reality in which companies operate as well as their prospects for success over the long term. Management teams for example will often undertake investments without understanding the true cost of capital generated by the project. This can result in the inadvertent destruction of shareholder wealth over time. At AGF, we seek to avoid those companies and focus instead on management teams that consistently allocate their capital in a way that creates future shareholder value.
Cash flow is king
One EVA measure we believe accurately determines future value creation is Cash Flow Return On Investment (CFROI). It is the internal rate of return achieved on all past capital invested and also takes into account how much capital is required for the firm to generate each dollar of cash flow. CFROI is more stable than other GAAP measures and it allows for cross-border comparisons.
But while CFROI shows us a company’s fundamental drivers, it’s not the whole picture: it doesn’t show how much economic value it has created or the future rate of value creation. To see this, we compare the stability of CFROI to the typical return on invested capital (ROIC) and other accounting metrics that help improve forecasts and track true economic profit generation. We also look at a firm’s weighted average cost of capital (WACC), which is based on the cost of debt and equity as well as tax rates. That serves as a firm’s hurdle rate, a minimum rate of return required for a company to break even on its investments in economic terms. An understanding of the drivers of CFROI is key to analysing a firm’s ability to create value and arrive at an appropriate valuation.
Beating the fade
Armed with EVA-based metrics, it is much easier to identify opportunities that cut across regional and country differences. Through a well thought out and properly implemented economic profit framework, skilled management can provide strategic direction for companies at the same time as they recognise and respond to game-changing global themes and opportunities to add economic value. Above all, it is vitally important that a firm’s management be able to allocate capital in a way that is tied to the firm’s internal measures of performance – not just to accounting metrics that might not truly reflect economic reality or the true value that has been added.
One important factor to look at is where a company is in the industry life cycle, particularly because younger, fast-growing firms are likely to earn higher rates of return on their capital. High innovation, low competition and high barriers to entry in the industry are three possible reasons why such firms are able to earn such high rates of return – but it doesn’t last forever. Over time, as a firm loses its competitive advantage, its rate of return on investments also declines – this is known as the “fade” in CFROI. In order to survive and remain profitable, companies have to beat the fade by making investment decisions that keep CFROI levels above the long-term cost of capital for as long as possible. Firms that don’t do this and operate below the cost of capital can ultimately destroy wealth and be forced to restructure, be acquired or face bankruptcy.
To stay competitive and avoid the fade, companies must focus on increasing margins and “sweating their assets”. This can be done by cutting costs to maintain margins through value-adding activities such as product segmentation or changing the product mix by continuously innovating to help drive sales. A high profile example of a company that was able to beat the fade in this manner is IBM, whose transformation from a computer hardware business to a software-focused company was the result of strategic decisions that added value for customers and decreased the asset intensity of the business.
Where are the opportunities
We have seen high CFROI in specific sectors within emerging markets where companies have traditionally been better at working their assets to bring costs down and improve returns: materials, consumer discretionary and consumer staples. Historically, for example, within emerging markets, Consumer Discretionary has demonstrated high levels of CFROI relative to its cost of capital. One way this has been achieved is through efficient inventory management systems. In the materials sector we also see examples of companies that understand the concept of sweating their assets: they are being more judicious with capital expenditures and developing their assets. Finally, in the consumer staples sector, there is an excellent opportunity to increase margins and make improvements.
Conclusion
As the global economic environment continues to shift and evolve post-2008, EVA will continue to be an important metric for uncovering opportunities for investors. As we get used to an era of slower growth, companies in every region and industry must focus on costs and ensure that money spent goes towards creating a sustainable business model. More than ever before, investors must understand and use measures and approaches that can help them identify where these opportunities are.
More Related Content...
|
|
|