Jeff Munroe of Darwin Alternative Investment Management looks at the benefits of selective investment into alternative assets, particularly those with...

December 1, 2022
Report

|
Written By: Steve Beckett |
Steve Beckett of Blue Owl looks at the benefits of direct lending, the largest constituent of the private credit market
Following steady growth since the global financial crisis, private credit is considered a distinct asset class within the alternative investment universe. As allocators’ commitment to alternatives grows, direct lending – the largest constituent of the private credit market – has proven to be highly cash generative and has demonstrated resilience in the face of broader market stress.
The potential for higher risk-adjusted returns in direct lending, relative to liquid high yield and bank loans, can be attributed to:
The scale of the businesses financed in the direct lending market continues to increase – a sign of the secular and, in our view, permanent transition to sponsors seeking a private markets solution rather than bank financing. On the Blue Owl Direct Lending platform, we have seen 44% annual growth (59 year-to-date) in the number of $1 billion unitranche opportunities we have reviewed in 2022.
While trying to time private markets is notoriously difficult, given the length of commitments, it is an interesting time to invest in direct lending. With unlevered yields on offer of 12-15%, and the top of the capital structure risk profile, it is an attractive relative value play compared to private equity, and many other public asset classes.
Direct lending in the context of the macro picture
Both the United States and Europe demonstrate significant recession risk. In the US, persistent, albeit moderating, inflation, and significant increases in benchmark rates portend a potential default cycle. In Europe, added geopolitical volatility and the risk of an energy crisis this winter add to their woes – not since the aftermath of World War II have the fortunes of the continent been so connected to the severity of the winter weather.
Figure 1: Bloomberg Recession Predictor
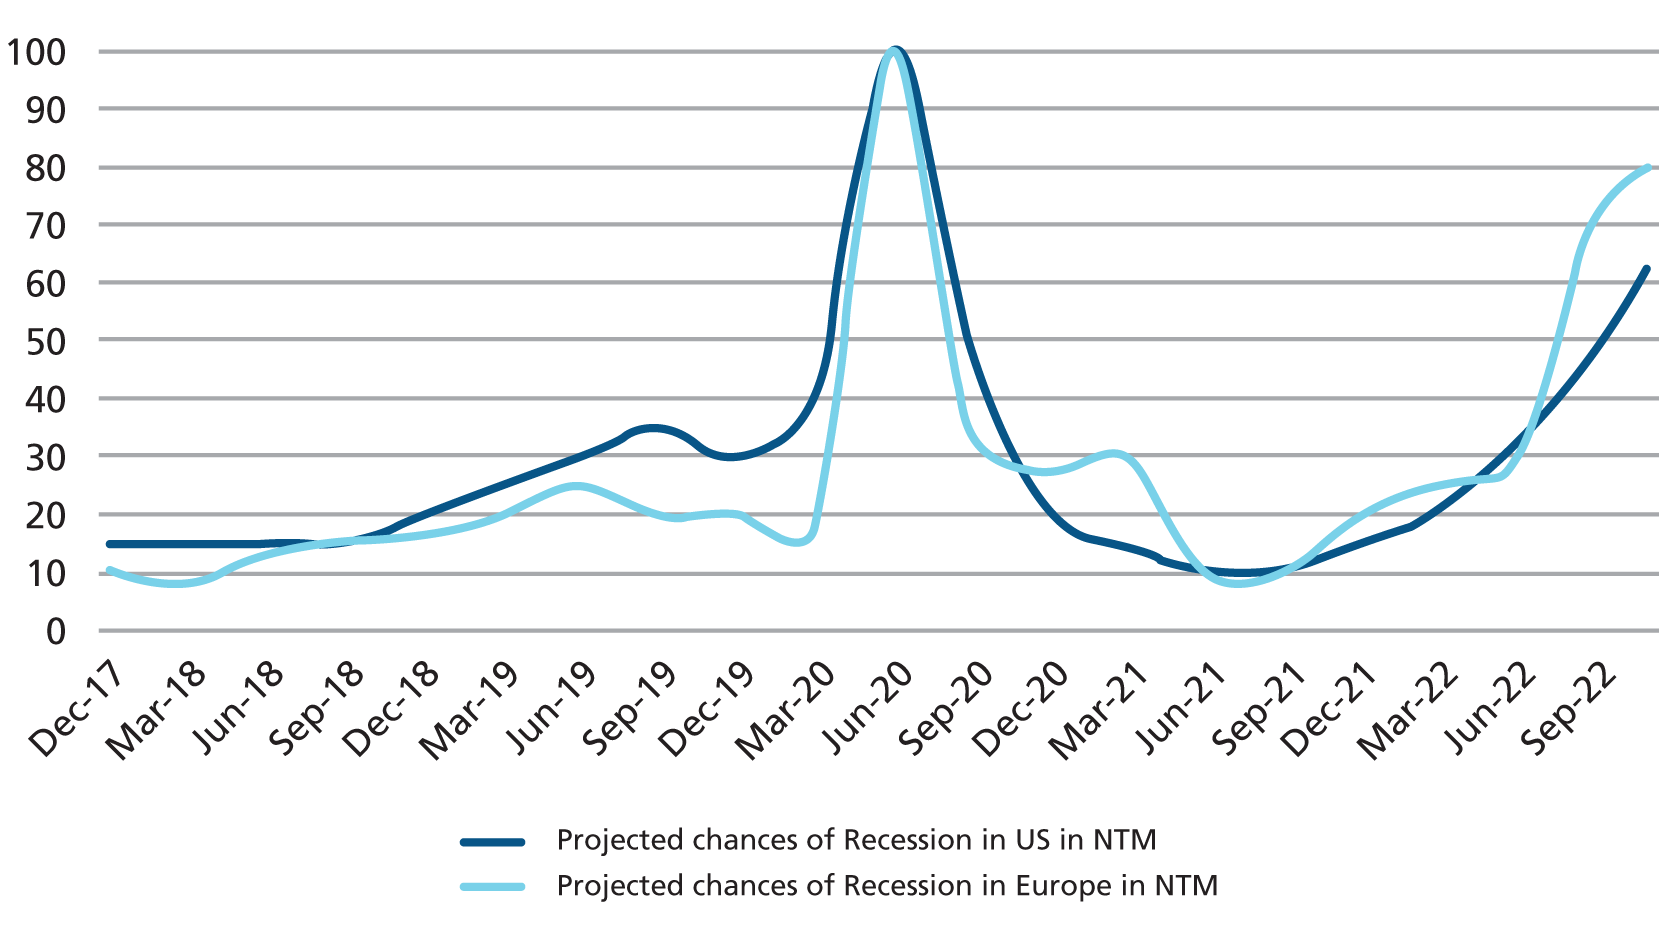
Source: Bloomberg
Inflation
The market is now pricing five-year inflation expectations of 4.1% for the UK, 3.3% for Germany and 2.4% for the US¹. This disparity is likely related to the negligible exposure to Russian energy products, and to the posture of the Federal Open Market Committee, who have already undertaken a significant programme of rate hikes and quantitative tightening.
Figures 2&3: US and European Benchmark rates

Source: Bloomberg
Inflation in the Eurozone is running at 10.6% versus 7.7% in the US². Based on implied futures pricing, the terminal benchmark rate in Europe is ~3%. More accommodative monetary policy in Europe should mean a lower chance of near-term stress in the economy, while perhaps increasing the chances of longer-term stagflation. For the private credit markets, as we compare the US and Europe, it means that the US, having taken its medicine, should rebound quicker, while in Europe a default cycle may be a slower moving beast.
The technical backdrop
To better understand what is happening in the direct lending market, it is important to understand the technical set-up of the leveraged loan market.
As enterprise value multiples of borrowers have softened in recent quarters, and with several high profile hung syndications (Citrix, Twitter, Nielsen), leveraged loan market issuance on both sides of the Atlantic has decreased substantially, and at 3Q22 is lower than during the nadir of the pandemic.
Figure 4: Institutional Loan Issuance – US & Europe

Source: Pitchbook LCD
The demand for new paper is closely related to the formation of institutional CLOs as the primary purchaser of leveraged loans. CLO issuance has slowed considerably since 4Q21. Demand has been further impaired by loan mutual funds – the next largest buyer of institutional loan paper – which have experienced two consecutive quarters of outflows.³
Structural support for long-term allocations to direct lending
The reduced activity in the leveraged loan market has accelerated a trend which was already long underway. Direct lending AUM now represents ~18% of the debt outstanding across the US high yield bond and syndicated bank loan markets – a 6x increase since 2010.⁴,⁵,⁶,⁷
Figure 5: Growth in Direct Lending Market Share

Sources: Bloomberg Barclays, US High Yield represents the Bloomberg Barclays US High Yield Corporate Index; S&P Global Market Intelligence, US Bank Loans represents the S&P US Leveraged Loan Index; Preqin, US Private Debt Report, 06/30/2022; Estimated Direct Lending Market share based on Direct Lending AUM / US High Yield and US Bank Loan amounts outstanding
Filling the direct lending fundraising shortfall
On the supply side, Preqin projects direct lending fundraising will continue to grow significantly in the coming years, at a CAGR of 21% in the US and 17% in Europe. Buyout fundraising growth is projected to grow at a slower pace – a 12% CAGR in the US and a 10% CAGR in Europe.
With an estimated $2 trillion of dry powder, PE sponsors have substantial capital at their disposal. Whether this capital is used to fund traditional buyouts or an increasing number of take-private transactions, which have seen a massive resurgence, remains to be seen. In any case, the PE community will likely find opportunities, and each opportunity will require leverage of 40-50% loan-to-value.
When we assess direct lending fundraising in the context of buyout fundraising, a sizable shortfall in direct lending capital becomes apparent – 23% in the US and 14% in Europe. The shortfall provides some long-term support for pricing and transaction structuring parameters.
Figure 6: Bridging the fundraising shortfall in Direct Lending

Source: Prequin
There has been a multi-decade trend of banks retrenching from lending. The capital charges of holding loans and the risk of hung syndications support the increased acceptance of private markets solutions. In this construct, securitisation of middle market lending portfolios will need to continue to keep pace with demand for leverage from sponsors. Demand for middle market CLOs is trending positively as the structures gain mainstream acceptance from the fixed income investment community.
Current direct lending opportunity set
Traditional LBO and M&A activity is down in recent quarters. This has been offset by take-private transactions. Over the last few years, Owl Rock would typically review a handful of take-privates each year – this year we have done work on approximately twenty. Despite a reduction in typical sources of deal flow, the mismatch between supply and demand of capital in upper middle market lending has never been more advantageous for direct lenders.
With banks sitting on $43 billion of hung paper⁸, syndicated market activity may remain subdued for some time. The imbalance is further exacerbated by slowing refinancing activity. As such the opportunity set in the US and Europe is among the most attractive it has ever been in terms of borrower fundamentals, pricing, and structure, having improved materially in the last 3-4 months.
Credit profile, documentation & collateral protection
In recent years, the European and US direct lending markets have begun to coalesce in terms of pricing and structure. Some small differences remain – see Figure 7.
Figure 7: Credit Quality Comparisons – US & Europe
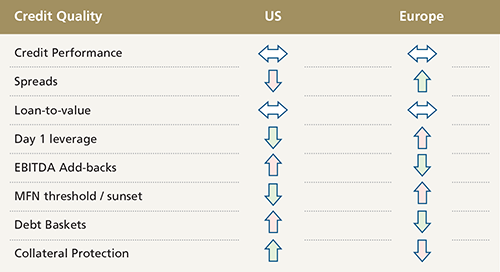
Source: Prequin
There is very little to choose between US and European loans in terms of spreads, LTVs, and Day 1 Leverage. Europe typically has slightly higher out-of-the-box leverage – as the definitions of EBITDA are somewhat tighter, true leverage is approximately the same in the aggregate. Regular-way unitranches in the US are now paying 675-700bps over SOFR with 300bps of upfront fees. In Europe, spreads can be 700bps +, albeit over considerably lower base rates.
Covid was not representative of a conventional default cycle, in that it was truncated by extraordinary government support. Direct lending transactions in both the US and Europe held up extremely well, and sponsors generally provided appropriate support – this was especially important at the beginning of the pandemic when uncertainty permeated every corner of the global economy.
In terms of enforcing collateral protections, the US and the UK enjoy an advantage over many civil law jurisdictions (France, Germany, etc.), where perfecting liens can be a challenge. In the US, the Uniform Commercial Code is the set of laws which governs all commercial transactions in the United States. UCC Article 9 provides a statutory framework for secured transactions and perfection of liens. In common law countries such as the UK, a Register of Charges is usually available, which functions in much the same way as Article 9. In many businesses, IP, brand value, and other intangibles can form a substantial portion of the value of the business. The pledge system employed in civil law countries often does not include intangible assets.
Diversifying portfolios through direct lending
Direct lending can provide meaningful diversification to institutional portfolios. The income-oriented nature provides current income and helps to mitigate the J-curve effect associated with other private market strategies. The floating-rate structure of most loans provides a hedge against rising rates and helps support positive performance across various macroeconomic environments.
Institutional investors can also consider using direct lending to diversify geographically. Home bias can be seen in substantially all institutional portfolios, sometimes by design, often unintentionally. One of the key factors that institutions must consider when making investments outside of their jurisdiction is how to hedge FX exposure.
Figure 8: Historical cost of hedging USD investment from Eurozone
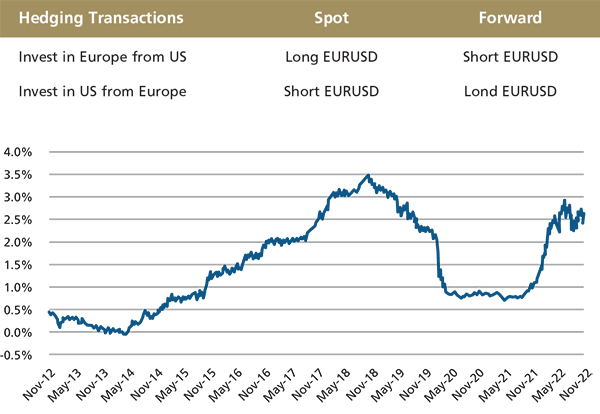
Source: Bloomberg
Over the past decade, US investors investing in Europe have traditionally enjoyed an average 150bps structural FX uplift when investing into euro-denominated strategies. This is because of the prevalence of investors outside the US seeking to sell the dollar forward to hedge US exposure. By taking the other side of the trade, US investors into Europe may benefit. The same paradigm exists with US investors investing in the UK, albeit to a lesser extent (50bps average uplift).
The US and the EU are the largest markets for financial products in the world. By having exposure to both, institutions broaden risk exposures and return streams. For European and UK investors seeking to invest in the US, the FX headwind is an unfortunate cost of this diversification. From a governance standpoint, accounting for the cost of hedging in the benchmark returns ensures staff are not penalised unfairly for hedging costs.
Takeaways for institutional investors
The mismatch between supply and demand of capital in direct lending has led to increased risk premia. We believe that the outperformance of direct lending versus non-investment grade public credit will persist. Whether underwriting direct lending investments in the US or Europe, while the product itself is homogenous, there can be significant diversification benefits from the exposure to the underlying markets.
Syndicated market dynamics, with investment banks underwriting loans to sell them down in their entirety to CLOs and loan-mutual funds, mean they are incentivised to offer the most borrower/sponsor-friendly terms. The opposite is true in the direct lending market where incentives should be properly aligned. There are certain key diligence items to consider that demonstrate how GPs can protect this alignment and constrain value leakage:
Important Information
Past performance is not a guide to future results.
This presentation is for informational purposes only and is not an offer or a solicitation to sell or subscribe for any fund and does not constitute investment, legal, regulatory, business, tax, financial, accounting, or other advice or a recommendation regarding any securities of Blue Owl, of any fund or vehicle managed by Blue Owl, or of any other issuer of securities.
Copyright© Blue Owl Capital Inc. 2022. All rights reserved. All individual charts, graphs and other elements contained within the information are also copyrighted works and may be owned by a party other than Blue Owl. By accepting the information, you agree to abide by all applicable copyright and other laws, as well as any additional copyright notices or restrictions contained in the information.
1. Source: Bloomberg on 11/21/2022
2. Source: Bloomberg on 11/21/2022
3. Pitchbook LCD
4. Bloomberg Barclays, US High Yield represents the Bloomberg Barclays US High Yield Corporate Index
5. S&P Global Market Intelligence, US Bank Loans represents the S&P US Leveraged Loan Index
6. Preqin, US Private Debt Report, 06/30/2022
7. Estimated Direct Lending Market share based on Direct Lending AUM / US High Yield and US Bank Loan amounts outstanding
8. https://www.bloomberg.com/news/articles/2022-11-17/wall-street-s-hung-debt-swells-to-43-billion-as-tenneco-closes
|
|
|