Credit where credit’s due

|
Written By: Jake Gaul |

|
David Morse |
Jake Gaul and David Morse of Standish Asset Management look at the prospects for credit in 2015
We expect moderate spread tightening in investment grade global credit markets in 2015 based on reasonably wide valuations, stable credit fundamentals and a continuation of the global reach for yield. We see greater opportunity for spread compression in the USD credit market, than we do in the EUR market. In 2014, the USD market widened 17 basis points (bps) while the EUR market tightened 27bps1, leaving EUR valuations fair and USD spreads attractive. Key drivers of success in 2015 will be how credit managers navigate the very wide trading Energy and Basics industries (Figure 1); and how they play an historically steep credit curve (Figure 2). Risks to our constructive outlook for spreads include renewed fears of sovereign debt contagion in Europe, a sharp slowdown in China and market dislocations caused by the US Fed hiking its policy rate.
Figure 1: Barclays Global Agg Corp – OAS (Bps) as of 31 Dec 2014
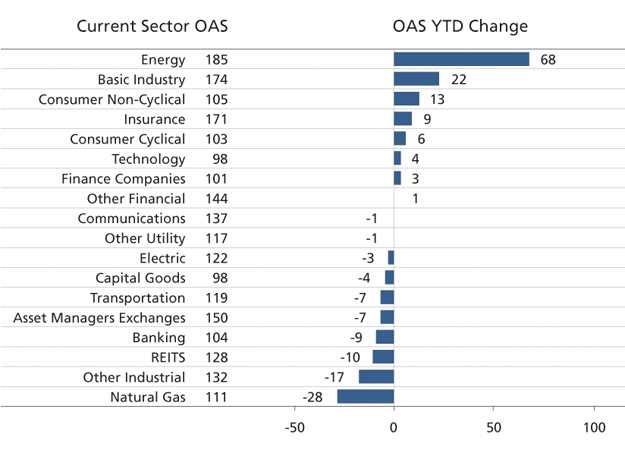
Source: Barclays POINT as of 31/12/2014
Fundamentals
Credit fundamentals have peaked, but remain stable. Revenue and EBITDA continue to grow at consistent, albeit slow, rates; particularly in those sectors with outsized exposure to the US (ie. Media, Healthcare and Utilities). We believe this trend will continue in 2015 with European growth expected to lag US growth. Profit margins continue to remain near their peak as companies have benefited from a lacklustre recovery in the labour market over the last seven years. However, if the employment picture continues to improve, we would not be surprised to see margins fall slightly this year, but overall they should remain at elevated levels. Perhaps the most troubling trend from a fundamental perspective is the continued increase in leverage as debt is growing faster than EBITDA. However, it appears that many companies have been opportunistically taking advantage of the historically low yields and have been prefunding future obligations which should lower future funding costs and improve interest coverage ratios. As a result, we expect debt growth to plateau once rates start to rise. Furthermore, leverage should stabilise if anticipated economic growth translates into EBITDA growth. We take further comfort in the fact that the majority of the increase in financial leverage is coming from single A-rated companies. In fact, triple B-rated issuers have actually reduced leverage which suggests companies continue to be focused on maintaining investment-grade ratings.
Figure 2: Spread Curve (Barclays US Credit Corp 10+ vs. 7-10) – 5 years
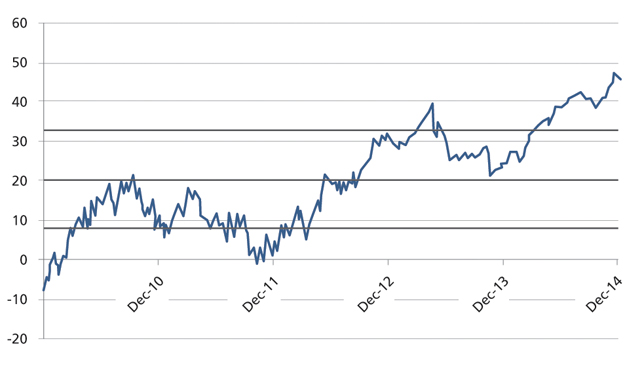
Source: Barclays POINT as of 31/12/2014
Technicals
The biggest difference between the US and European markets has been, and will continue to be, related to technicals. After three consecutive years of record-breaking supply, US IG bond issuance is likely to top $1 trillion for the fourth consecutive year as companies look to fund M&A activity, share buybacks and capital expenditures with low cost debt. In addition, bank issuance will increase in 2015 compared to 2014 levels, with the most significant increase in senior holdco issuance at money-centre banks. The increase in supply will be driven by Total Loss Absorption Capacity (TLAC) requirements. While the exact figures have yet to be determined, it is estimated that these requirements could result in $200 billion of additional issuance over the next five years. However, we believe the market will continue to absorb the elevated issuance given the fact that the overall supply of spread product is half of what it was seven years ago, because the securitised market is only a fraction of what it was before the crisis. Furthermore, US IG credit should be supported by continued demand from foreign central banks, sovereign wealth funds and pension plans, particularly if government rates begin to rise in 2015.
Unlike in the US, Europe has experienced a lack of IG supply over the past five years (Figure 3). This technical “tailwind” could grow stronger if the European Central Bank begins its quantitative easing program, which may even include corporate bonds. Regardless of whether or not corporates are included in the ECB’s programme, any form of QE should be a supportive technical for the corporate bond market as it reduces supply, limits volatility, compresses spreads and pushes investors up the value chain in search for yield. While we do expect a modest uptick in EUR supply as more cross-border issuers will look to access the European market to take advantage of very low “all-in” funding costs, this incremental supply may not be enough to offset the overwhelming impact of the ECB’s involvement in the market.
Figure 3: Investment Grade Net Issuance
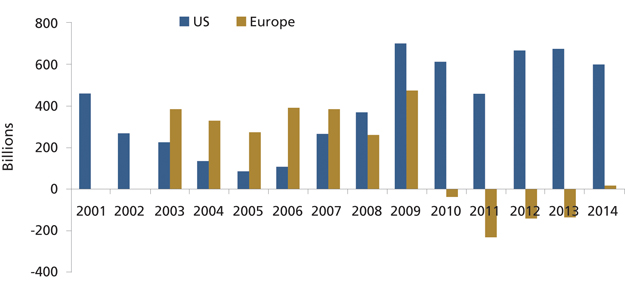
Source: Barclays as of 31/12/2014
Valuations
At +123bps over government yields, the Barclays Global Corporate index is trading below its 10-year average of +165bps, but still well above the pre-crisis tights (+65bps set in February 2007). It is important to note that this average is clearly influenced by two extremely stressed periods; the US financial crisis of 2008/2009 when spreads peaked at 515bps and the European sovereign debt crisis in 2011 when spreads peaked at 290bps. Furthermore, the composition of the index has changed; this global index is now longer duration (6.4 years today vs. 5.6 years in 2006), lower rated (A2/A3 now vs. A1/A2 in 2006) and has a smaller weight in the financial sector (40% now vs. 52% in 2006).1 Even after adjusting for these differences, we believe global corporate spreads continue to offer attractive relative value.
Given the sharp divergence between US and European spreads in 2014 (Figure 4), we believe it is important to examine the relative valuations of these two markets independently. The US currently offers a significant spread pick up vs. Europe (+130bps vs. +88bps). While some of this differential can be attributed to the fact that the US market is longer duration (7.25 vs. 4.92) and has a larger weight in energy (8.57% vs. 3.26%), a significant portion is due to technicals (as mentioned above).¹ While 2014 taught us that technicals can be a very powerful force, we believe, at current levels, the US offers attractive relative value vs. Europe given the differences in the future economic growth prospects and all in yields.
Figure 4: Barclays US Credit Corp OAS vs. Euro Agg Corp OAS – 5 years
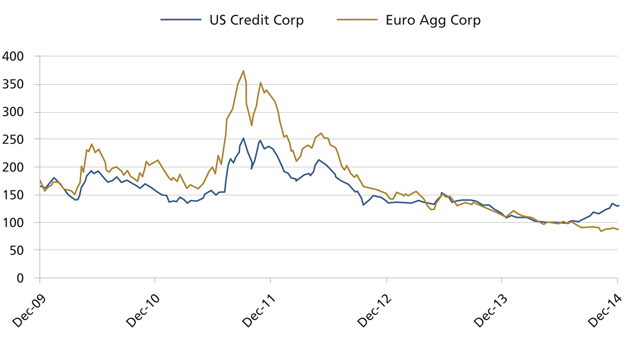
Source: Barclays POINT as of 31/12/2014
Conclusion
2015 is likely to be an eventful year in credit markets, as it has been each year following the 2008/2009 US financial crisis. The extreme involvement of central banks, global deflation fears and the recent collapse in the price of oil will all help to dictate the direction of credit markets in 2015. It remains our view that global demand for high quality income-producing assets will remain strong in 2015. And with reasonably wide spread valuations and a stable environment for fundamentals in our investment grade universe, we expect the direction of credit spreads to move tighter this year.
1. Barclays POINT as at 31 December 2014
More Related Content...
|
|
|