Embracing net zero targets the right way

|
Written By: Pascal Dudle |

|
Matthias Fawer |
Pascal Dudle and Matthias Fawer of Vontobel detail a method of calculating emissions which can help investors support net zero goals
Many environmental buzzwords have emerged over the past two decades and “net zero” is a recent favourite – it alludes to the ability of a country or a company to remove the same amount of carbon out of the atmosphere as it emits. Should this be achieved, human-caused global warming would theoretically stop.
Greenhouse gas emissions are higher than ever1 and emissions are mainly caused by the world’s most industrialised nations, leaving Africa, South America and Asia to bear the brunt of the negative effects. If western companies are the cause of most greenhouse gas (GHG) emissions and the depletion of natural resources, the onus is on them to get things right. One way of doing this is by adopting a strategy to cut carbon emissions, and to act on it. Accordingly, the number of companies with net zero2 commitments increased sharply in 2021 due to tightening regulation, shareholder pressure, or peer action, research by the Bank of America shows (Figure 1). In practice, such a commitment is expressed by management’s consideration of zero carbon emissions as an integral part of their decision-making process.
Figure 1: Making “net zero” pledges is one thing, committing to dates is another | Companies’* zero carbon emissions plans and timelines
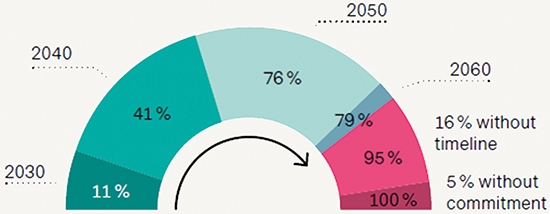
* Based on Bank of America (BofA) Global Research 2022 survey of approx. 3,400 companies | Source: BofA.
Not so many corporate heroes with net zeros
However, net zero targets as a means of stopping climate change aren’t beyond doubt. The New York Times, for one, says such goals could lead to empty promises and even obstruct efforts to stop climate change with too many companies kicking the can down the road3. Moreover, most only address scopes 1 and 2, i.e. carbon emissions generated during the manufacturing process, leaving out so-called scope 3 emissions that take stock of the entire value chain and lifecycle of the product (Figure 2). Another sore point is the reliance on immature technologies like carbon capture for emission mitigation. The New York Times points out that to date, only 19 carbon capture plants exist globally, which is hardly enough to remove the annual emissions of 700 Americans. The publication also questions the practice of hiding behind “nature-based solutions”, i.e. planting trees to offset emissions.
Figure 2: Carbon footprint method too narrow, fails to cover all emissions over product’s lifecycle | There is no widely accepted yardstick for “scope 3” emissions
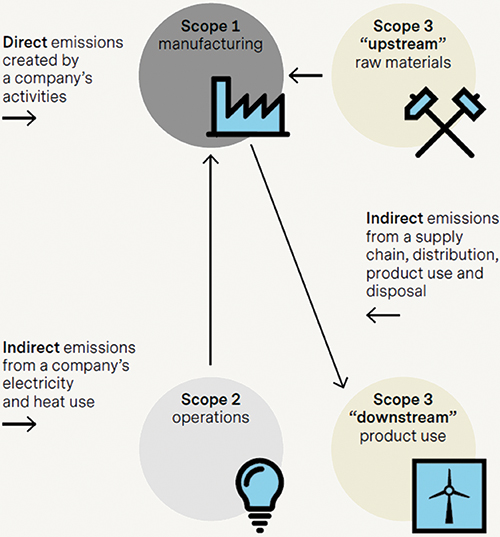
Source: Vontobel (for illustrative purposes only)
Carbon footprint vs potentially saved emissions
Even so, we think the corporate world’s initiative to bring carbon emissions down is commendable, but what does it mean for investors and how can they support net zero emission goals?
A widely used starting point is the carbon footprint, with investors typically preferring portfolios with a lower footprint than a relevant peer group. Yet in our opinion, this measure is too narrow because it usually only considers a company’s scope 1 and 2 carbon emissions (see definition above), thus missing the effect its products and services have on the real world. For instance, tech companies like the so-called FAANG stocks (Facebook, Amazon, Apple, Netflix and Google) or their Chinese equivalents (Baidu, Alibaba and Tencent) have a low carbon footprint relative to their revenues or market capitalisation, but their businesses do little to reduce society’s climate footprint.
What is a possible way forward? As active managers with the ability to look at each company in depth, we can draw on the skills of the ISS ESG climate experts and a method called “potential avoided emissions”, or PAE. By covering the emissions of the entire value chain, it enables an assessment of a company’s potential contribution to achieve climate change mitigation, lending itself to a solution-oriented capital allocation. To gauge the sustainability credentials of existing portfolio holdings or possible new additions, we ask company management to provide data to calculate avoided emissions4 relative to a standard product or an industry reference.
To illustrate the difference in methods, let’s look at an example. If we include all emissions of a wind turbine’s entire value chain (producing, installing, and decommissioning5), it emits approximately 640 tons of carbon dioxide per megawatt of power installed. By contrast, if we consider the amount of CO2 emissions a wind turbine “avoids” relative to a fossil fuel power plant, we arrive at a multiple of 50 (Figure 3).
Figure 3: “Potential avoided emissions” (PAE) method brings out a product’s real environmental benefit | The carbon footprint measure shows a product’s carbon dioxide emissions (bottom left), but the PAE measure reflects the potential to save them (bottom right).
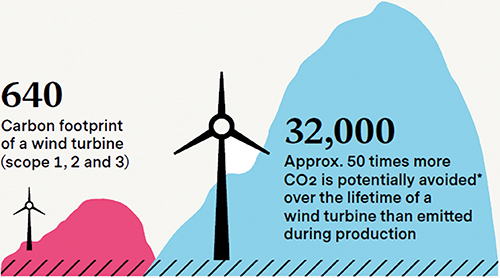
* PAE over the lifetime of a wind turbine; tons of CO2 per megawatt of wind power installed. | Source: Vestas Sustainability Report 2021, Vontobel.
There are many other examples highlighting the advantage of the more complete method. In our view, it’s a PAE perspective that can highlight the environmental benefit of train versus car travel, or the benefits of energy-efficient buildings over those without insulation.
There are a few companies that excel in terms of low carbon footprint, but a closer look reveals their achievements don’t always stand up to proper scrutiny. We believe a focus on the “real” champions as suggested by the holistic PAE method is much more rewarding, albeit much more demanding in terms of research. In our opinion, companies that should be of interest include Vestas, a Danish wind turbine manufacturer; Saint-Gobain, a French-based supplier of high-performance glass for buildings and Andritz, an Austrian provider of equipment for hydropower plants.
Legal notice
This marketing document was produced by one or more companies of the Vontobel Group (collectively “Vontobel”) for institutional clients.
This document is for information purposes only and nothing contained in this document should constitute a solicitation, or offer, or recommendation, to buy or sell any investment instruments, to effect any transactions, or to conclude any legal act of any kind whatsoever.
This document is not the result of a financial analysis and therefore the “Directives on the Independence of Financial Research” of the Swiss Bankers Association are not applicable. Vontobel and / or its board of directors, executive management and employees may have or have had interests or positions in, or traded or acted as market maker in relevant securities. Furthermore, such entities or persons may have executed transactions for clients in these instruments or may provide or have provided corporate finance or other services to relevant companies.
Although Vontobel believes that the information provided in this document is based on reliable sources, it cannot assume responsibility for the quality, correctness, timeliness or completeness of the information contained in this document. Except as permitted under applicable copyright laws, none of this information may be reproduced, adapted, uploaded to a third party, linked to, framed, performed in public, distributed or transmitted in any form by any process without the specific written consent of Vontobel. To the maximum extent permitted by law, Vontobel will not be liable in any way for any loss or damage suffered by you through use or access to this information, or Vontobel’s failure to provide this information. Our liability for negligence, breach of contract or contravention of any law as a result of our failure to provide this information or any part of it, or for any problems with this information, which cannot be lawfully excluded, is limited, at our option and to the maximum extent permitted by law, to resupplying this information or any part of it to you, or to paying for the resupply of this information or any part of it to you. Neither this document nor any copy of it may be distributed in any jurisdiction where its distribution may be restricted by law. Persons who receive this document should make themselves aware of and adhere to any such restrictions. In particular, this document must not be distributed or handed over to US persons and must not be distributed in the USA.
1. Greenhouse Emissions Rise to Record, Erasing Drop During Pandemic, International Monetary Fund blog post, June 30, 2022. imf.org/en/Blogs/Articles/2022/06/30/greenhouse-emissions-rise-to-record-erasing-drop-during-pandemic
2. “Net zero” has come to signify the ability of a country or a company to remove the same amount of carbon out of the atmosphere as they emit. Should this be achieved, global warming would theoretically stop.
3. Net Zero Global Warming – just a flaw? New York Times: Opinion Video, July 2022
4. Avoided emissions are emissions that would have been released if a particular action or intervention had not taken place. Also see Potential Avoided Emissions (PAE): Dataset & Bespoke offering, ISS ESG, April 2022.
5. To compare like-for-like, we have included scope 1, 2 and 3 for the calculation of the carbon footprint as well.
More Related Content...
|
|
|