Inside the engine room of emerging market local currency debt

|
Written By: Andrew Keirle |

|
Paul Gallagher |
Andrew Keirle and Paul Gallagher of T. Rowe Price explore different aspects of the risk and return drivers of the potentially rewarding EMLC asset class
Emerging Market (EM) local currency debt is a complex asset class that can behave very differently over different time horizons, and this can make it challenging for investors to analyse the opportunity. In this piece we will look at how investors might frame the opportunity more clearly, exploring ways to think about the risk and return drivers of this potentially rewarding asset class.
EM local currency (EMLC) debt is essentially a government bond investment, driven by currency and sovereign risk. It might be thought of as a higher-yielding, higher-risk extension of an investor’s global government bond allocation rather than solely part of an EM allocation. The starting point for any analysis is recognising that the total return to investors in EMLC debt consists of three distinct drivers: coupon, price appreciation and currency (FX). We’ll begin by looking at the impact of time horizon on EMLC investment outcomes and the role played by the different return drivers. We’ll then discuss some underlying dynamics of the return drivers, seeking to draw investment implications for asset owners and asset managers along the way.
The importance of investment horizon
It is tempting for investors to view EM local currency debt as a volatile asset class. This is understandable given that it seldom makes headlines except at times of market turbulence – often in the form of currency weakness. As a result, the blow-ups tend to eclipse the steady, consistent properties that make EM local currency debt worthwhile. Away from such short-term noise, and in common with most asset classes, the level of realised volatility of the returns differs markedly depending on the holding period.
Figure 1 shows historical EM local currency debt performance from two angles: the dispersion of returns and the volatility of those returns. The box and whisker chart shows returns measured over one- and 10-year holding periods, on a rolling monthly basis, since 2002. The distribution of these returns is substantially narrower for the 10-year holding periods – a pattern that occurs to varying degrees in most asset classes, for different reasons. In the next section we’ll discuss the factors behind the short-term dispersion on the one hand and long-term compression on the other.
Figure 1: The impact of time horizon – 31 December 2002 – 31 October 2018
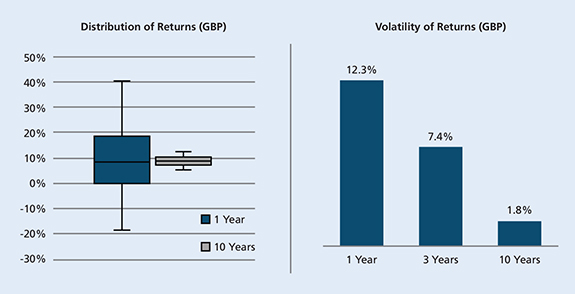
Past performance is not a reliable indicator of future performance.
Return distributions: Annualised one-and ten-year returns for the J.P. Morgan GBI-EM Global Diversified Traded Index, rolled monthly. Volatility: Annualised standard deviation of one-, three- and ten-year returns for the J.P. Morgan GBI-EM Global Diversified Traded Index, rolled monthly.
Source: J.P. Morgan Chase & Co.
Given that returns over 120-month holding periods have been more stable than those over 12-month periods, we would expect to see this pattern reflected in the volatility numbers. The bar chart shows the volatility of the rolling one- and 10-year periods already discussed and adds volatility for rolling three-year periods. On an annualised basis, volatility over three- and 10-year periods has been significantly lower than it has for one-year periods.
The holding period over which to examine the volatility of an investment is an important (and often incorrectly made) decision. Many investors use monthly return data, as a default, to estimate the volatility of an asset class. But this prism only makes sense if you expect to invest in and out of the asset class for periods of a month. Most investors tend to hold the investment for much longer horizons, typically years. This implies that the correct measure of the range of possible investment outcomes is best measured in terms of the volatility of longer holding periods, aligning the calculation period with the investment period.
Decomposing the drivers of performance
We have noted that longer holding periods are associated with narrower distributions of returns in EM local currency. The reason lies in the changing importance, over time, of the underlying return drivers of the asset class. The total return to investors in EM local currency debt consists of three related, but distinct, components:
- Coupon: The regular coupons paid on the debt by the issuing sovereigns over time.
- Price: Returns from price appreciation based on mark-to-market local interest-rate movements.
- Currency: The impact of currency fluctuations on the value of both the principal and the coupons, given that both are denominated in EM local currency rather than the investor’s base currency.
Figure 2 shows the proportionate contribution to total return at the asset class level of the three return drivers. As the chart makes clear, over short investment periods the largest driver of returns is the currency component. Over time, the largest driver becomes the coupon component. Interestingly, currency is the most volatile component, driven by FX movements, while coupon is very stable. As coupon payments accumulate over time, they account for a growing proportion of cumulative total return. By implication, as the less volatile component becomes dominant, superseding the more volatile component over longer and longer investment periods, the asset class as a whole must become less volatile.
Figure 2: Drivers of performance over time – 31 December 2002 – 31 October 2018
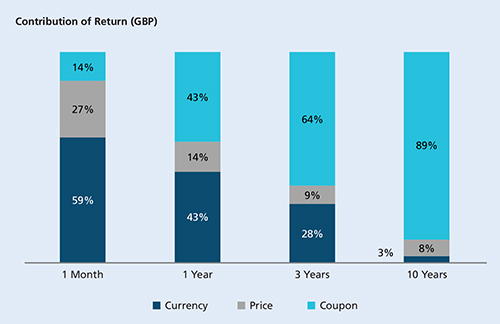
Past performance is not a reliable indicator of future performance.
Chart shows percentage of the squared returns for each component, over specified window, for the J.P. Morgan GBI-EM Global Diversified Traded Index. Numbers may not sum due to rounding.
Source: J.P. Morgan Chase & Co.
For investors considering the asset class, it is important to establish their investment time frame in advance. Shorter-term investments require a view on the direction of EM currencies and sufficient risk appetite to absorb short-term FX volatility. Longer-term investments acknowledge the growing importance and attractiveness of the coupon component.
Figure 3: The asset class and its components
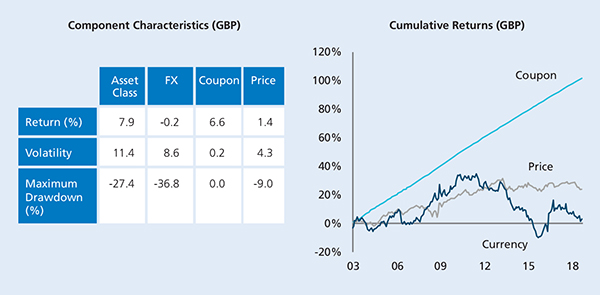
Past performance is not a reliable indicator of future performance.
Component characteristics: J.P. Morgan GBI-EM Global Diversified Traded Index, based on monthly data. Return and volatility are annualised. Maximum drawdown is measured from peak to trough over the period from 31 December 2002 to 31 October 2018. Cumulative returns: components of the J.P. Morgan GBI-EM Global Diversified index (base = January 2003), as of 30 September, 2018.
Source: J.P. Morgan Chase & Co.
From a manager selection perspective, the divergent behaviour of the return drivers highlights the dangers of placing undue emphasis on short-term performance. For example, looking at a sample of managers on a one-year horizon, the winners will likely be those who spend a significant portion of their risk budget on active currency positioning to drive alpha. Over a longer time horizon, large currency bets are likely to be less important; the winners will be those who can collect coupon and generate idiosyncratic alpha via security selection.
Putting this a different way, the short-term view gives a good picture of the interaction between a manager’s currency stance and the way the currency has moved, but it may reveal little about the manager’s bond selection skills. This is why it’s important to identify what exposures managers are using to generate alpha.
Risk and return relationships
The historical paradox of EM local currency is that the lower-risk components have delivered the highest return, while higher-risk components have produced the lowest return. As shown in Figure 3, the driver of risk in EMLC has clearly been the FX component.
The coupon component has been by far the largest driver of long-term returns for the asset class, with minimal volatility (given predictable, contractually agreed coupon flows) and no drawdowns. This is consistent with the investment grade credit quality of the index. At the end of September 2018, the 19 sovereign issuers1 in the J.P. Morgan GBI-EM Global Diversified Index had an average credit quality of BBB and a yield of about 6.6%. The index has a default rate of 0% since inception in June 2005, compared with an average of 2.35% for the J.P. Morgan Global High Yield Index over the same period (high-yield defaults hit a high of 10.98% in November 2009).
Price appreciation returns from duration exposure reflect the general long-term downward trend in EM interest rates, helped by structural reforms and a long-term improvement in fundamentals. As shown in the volatility and drawdown numbers and the cumulative returns, passive duration exposure has had some ups and downs within the upward trend.
Learning to live with currency risk
Given that currency has offered the lowest return-to-risk trade-off over time, it would seem an obvious strategy to separate out the three components and invest only in the low-risk, high-return coupon component. Sadly, this is not possible to do. The asset class is a package of its underlying components and investors need to be exposed to all their risks and returns.
The main reason for this is that the cost of hedging out the FX risk through currency contracts can remove almost all the income, as emerging markets have high front-end rates that are only marginally lower than their long-end rates. While yield curves globally are relatively flat, emerging markets are also competing for international capital, so they tend to have higher interest-rate structures, particularly at the shorter end. Moreover, when EM countries are under stress, much of the pressure is felt through the currency (assuming a free float). This often has a knock-on impact at the short end because EMs have a tendency to adjust policy procyclically. In other words, while a developed country might not need to adjust policy to deal with currency weakness, emerging markets tend to be capital importers. So policymakers often choose to raise short-term rates to try to shore up confidence, as recently witnessed in Argentina and Turkey.
While investors cannot profitably isolate and remove all currency exposure, they can be selective about the FX risks they take. Our discussion so far has focused on the asset class as represented by index-level data, which assumes passive exposure. Active managers can manage risk with a range of techniques such as relative-value pairings and funding EM long positions with non-dollar developed market currencies to reduce short dollar exposure.
Two asset classes in one
The starkly different behaviour of the drivers of EM local currency returns implies that it makes sense to think of it as two separate asset classes in risk terms: a relatively high-yielding government bond portfolio and a potentially volatile currency stream.
Over the past decade, one obvious challenge in currency management has been the impact of US dollar strength on EM FX returns. More generally, the Sharpe ratio available from a given currency can be persistently low, because currency valuations can deviate from their fair value for a long time; a valuation-based assessment on a given currency can stay “wrong” for extended periods. Currency also tends to move in a wider range around a variable fair value so that it’s not unusual for a currency to be more than 20% over- or undervalued for an extended period.
Bonds, on the other hand, are more driven by investment flows, which helps create a valuation “anchor” where over- or undervaluation tends to result in an adjustment. One explanation is that there are dedicated investors whose actions tend to “regulate” the price of bonds. For example, the insurance and pension-fund investor base in Malaysia is likely to step in and buy domestic government bonds if yields reach a given level, but they would not respond to a cheapening ringgit in the same way. The self-correcting mechanism for currency is a change in the fundamentals, which can take longer to feed through.
For managers seeking to use their clients’ risk budgets efficiently, these relationships have important implications. We argued earlier that managers should approach bond and currency exposure as two separate asset classes. In bond selection, we think stronger valuation anchors, together with compensation for risk in the form of a coupon, justify a pure alpha-seeking approach. In currency selection, weaker valuation anchors and a more volatile profile imply that the primary focus should be on volatility management, with active return generation as a secondary objective.
Active currency selection can be an attractive source of alpha, so long as investors are mindful of the risks and cognisant that reversion to fair value can take time. In an asset class where the penalty for being wrong can be costly, our preference is for active risk to be taken in the form of multiple smaller bets rather than few large exposures.
Conclusion
We think the best way to think about EM local currency debt is that the reward (return) comes from the coupon, the risk comes from the currency, and the duration exposure is a more traditional bridging risk-return relationship. The most important driver in the short term is currency, while over the longer term it is the coupon. These subtleties of risk and return drivers, and their relative importance over time, are key to understanding the asset class.
While investors cannot cleanly access the three components of EM local currency separately, they can tilt their exposure towards or away from one or more of these drivers.
1. Argentina, Brazil, Chile, Colombia, Czech Republic, Dominican Republic, Hungary, Indonesia, Malaysia, Mexico, Peru, Philippines, Poland, Romania, Russia, South Africa, Thailand, Turkey.
Important Information
This material is being furnished for general informational purposes only. The material does not constitute or undertake to give advice of any nature, including fiduciary investment advice, and prospective investors are recommended to seek independent legal, financial and tax advice before making any investment decision. T. Rowe Price group of companies including T. Rowe Price Associates, Inc. and/or its affiliates receive revenue from T. Rowe Price investment products and services. Past performance is not a reliable indicator of future performance. The value of an investment and any income from it can go down as well as up. Investors may get back less than the amount invested.
The material does not constitute a distribution, an offer, an invitation, a personal or general recommendation or solicitation to sell or buy any securities in any jurisdiction or to conduct any particular investment activity. The material has not been reviewed by any regulatory authority in any jurisdiction.
Information and opinions presented have been obtained or derived from sources believed to be reliable and current; however, we cannot guarantee the sources’ accuracy or completeness. There is no guarantee that any forecasts made will come to pass. The views contained herein are as of the date noted on the material and are subject to change without notice; these views may differ from those of other T. Rowe Price group companies and/or associates. Under no circumstances should the material, in whole or in part, be copied or redistributed without consent from T. Rowe Price.
The material is not intended for use by persons in jurisdictions which prohibit or restrict the distribution of the material and in certain countries the material is provided upon specific request.
It is not intended for distribution to retail investors in any jurisdiction.
Issued by T. Rowe Price International Ltd., 60 Queen Victoria Street, London EC4N 4TZ which is authorised and regulated by the UK Financial Conduct Authority. For Professional Clients only.
T. ROWE PRICE, INVEST WITH CONFIDENCE and the Bighorn Sheep design are, collectively and/or apart, trademarks or registered trademarks of T. Rowe Price Group, Inc. All rights reserved.
201811-654073
More Related Content...
|
|
|