Simon Hazlitt of Majedie Asset Management points out the dangers of a project management approach to investment strategies and the...

April 1, 2016
Report

|
Written By: Richard Curling |
Richard Curling of Jupiter Asset Management discusses strategies that can help balance the active and passive elements of an investment portfolio
One of the big issues facing local government pension schemes is how to marry the active and passive elements of their pension fund in a way that is both cost effective and efficient in terms of adding the most value possible.
Passive or index investing has its uses of course, but like all investment approaches it is not a panacea. In my view it only has a competitive advantage if the overall running costs are significantly lower than active competitors. Furthermore, passive investing is usually only as good as the index that is being tracked. Consider Ryanair – the fares may be cheaper but the planes don’t always fly to the airport you want.
Likewise, the FTSE All Share Index may be the broadest measure of the British stock market but it is not necessarily the ideal portfolio benchmark for every investor, nor one that best reflects the UK domestic economy.
That’s because a small number of very large, slow-growing companies have a disproportionate and dominant effect on investors’ returns while medium-sized, faster-growing companies are underrepresented. Furthermore, many of these megacap giants obtain their profits from narrow economic areas in the global economy such as oil, tobacco and pharmaceuticals. Some investors might not want such concentrated sector risk.
In practical terms, pension schemes need to avoid duplication of large holdings across both active and passive parts of their overall fund. They may also need to think about their sterling exposure to better match their scheme’s liabilities. One innovative way of achieving this is to use an “ex-megacap” mandate for the active part of the UK equity fund. This is a mandate that excludes for example the top 20 companies in the UK index and, as a result, excludes 50% of its market capitalisation.1 Removing the larger trees allows scope for the younger saplings to grow. At Jupiter we created this strategy for a large, long-standing local authority client. This was in response to their need for a genuine diversifier, i.e. to give “true” exposure to the UK economy and to avoid the perils of overlap with their passive exposure.
Our strategy provides a very different risk profile to the All Share Index; at the sector and industry level it reduces exposure to the big sectors that dominate the index such as banks, oils, pharmaceuticals and mining. At the stock level it also eliminates potentially over-dominant, large individual stock weightings from the benchmark. So whilst Royal Dutch Shell is over 6% of the All Share Index1, the largest stock in our benchmark is WPP at under 2%.
Our strategy also increases the exposure to the domestic UK economy as many of the megacaps are essentially international businesses. This therefore provides a potentially better liability match for schemes with domestic UK liabilities. A further potential benefit is that it simultaneously tries to avoid much of the duplication that would otherwise occur across global and index funds which, by their very nature, have the greatest exposure to the largest stocks in the index. Although some believe this can be achieved by holding smaller company shares, such an approach can have the major drawback of illiquidity as anyone who has tried to liquidate a small companies portfolio will know. In contrast, our portfolio has only 12% in smaller company shares.
Once these mega caps are excluded, you end up with a more genuinely active stock picker’s portfolio in my view. This high “active share” approach has historically performed better and delivered outperformance after fees.2
By using this type of portfolio alongside a passive fund we also look to ensure that we fulfil our corporate governance obligations in a way that may not always be available with passive funds alone. In addition to these advantages, our benchmark has been less volatile than the All Share Index.
Looking back, there is a reason why many smaller companies have remained small, while giant companies often have their best days for growth behind them. It is the middle ground of midcap stocks where in our view the best opportunities are to be found in the UK (see Figure 1). We also find that such companies are not as widely followed by City analysts and can therefore offer us greater scope to generate returns for our clients.
Figure 1: FTSE 250 Index vs FTSE All Share Index. Percentage growth (total return) 15 years to 31 March, 2016
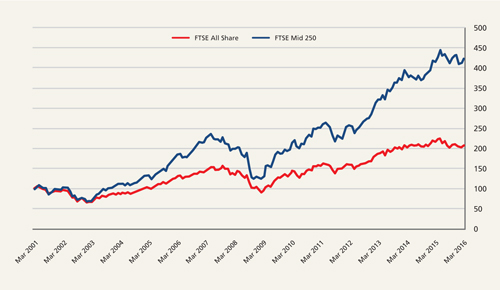
It is the middle ground of midcap stocks where in our view the best opportunities are to be found in the UK. Source: Bloomberg, GBP, net income reinvested. Past performance is no guide to the future
To summarise, the fund that we manage along these lines for a local authority client has so far achieved its objective at several levels and we believe has a number of clear advantages:
It would seem therefore that the “ex-megacap” mandate meets the needs of asset allocators on several fronts and could therefore be considered as a useful contribution to overall strategy.
Important Information
The above commentary is for informational purposes only and is not investment advice. Market and exchange rate movements can cause the value of an investment to fall as well as rise, and you may get back less than originally invested. The views expressed are those of the Fund Manager at the time of preparation, are not necessarily those of Jupiter as a whole and may be subject to change. This is particularly likely during periods of rapidly changing market circumstances. Every effort is made to ensure the accuracy of any information provided but no assurances or warranties are given.
Past performance is no guide to the future.
This document contains information based on the FTSE All Share Index and the FTSE 250 Index. ‘FTSE®’ is a trade mark owned by the London Stock Exchange Plc and is used by FTSE International Limited (‘FTSE’) under licence. The FTSE All Share Index and the FTSE 250 Index are calculated by FTSE. FTSE does not sponsor, endorse or promote the product referred to in this document and is not in any way connected to it and does not accept any liability in relation to its issue, operation and trading. All copyright and database rights in the index values and constituent list vest in FTSE.
Jupiter Asset Management Limited (JAM) is authorised and regulated by the Financial Conduct Authority and its registered address is The Zig Zag Building, 70 Victoria Street, London, SW1E 6SQ. No part of this commentary may be reproduced in any manner without the prior permission of JAM.
1. Bloomberg 6.4.16
2. ‘How Active is your Fund Manager? A New Measure That Predicts Performance’, Martijn Cremers and Antti Petajisto, March 2009.
|
|
|