Making the most of your MAC strategies
Published: October 1, 2016
Written By:

|
David Scott |
David Scott of Stone Harbor examines why changes in market fundamentals may push asset allocation to the centre of multi-asset credit strategies
Over recent years, multi-asset credit has become increasingly mainstream as investors, faced with a low nominal yield environment, have focused on total return rather than benchmark-orientated returns. Very broadly speaking, multi-asset credit mandates have taken one of two directions: either a heavily bottom-up credit orientated research process typically focusing on less liquid segments of the fixed income universe; or those that combine both a bottom-up credit research process with a top-down, macro-oriented asset allocation process. The former tend to look through the investment cycle, believing that strong security selection will ultimately drive returns, whilst the latter combines this with a top-down approach aimed at taking advantage of the ups and downs of the investment cycle to both control portfolio risk and enhance returns. Given that the essential difference between these two approaches is the asset allocation decision, what have we learned about asset allocation over recent years?
Let us first look at the returns to credit risk across a variety of asset classes. Figure 1 shows asset class credit returns (duration hedged) split into two distinct periods – a bear market (end September 2014 to end January 2016) and a subsequent recovery phase (end January 2016 to end August 2016).
Figure 1: Credit beta returns
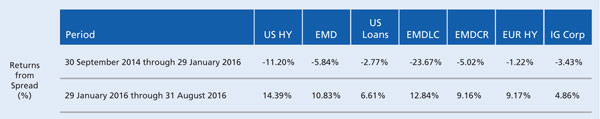
Performance reflects representative asset class benchmarks. HY: BofA Merrill Lynch US High Yield Constrained Index; EMD: J.P. Morgan EMBI Global Diversified; Loans: S&P/LSTA Leveraged Loan Index; EMDLC: J.P. Morgan GBI-EM Global Diversified; EMDCR: J.P. Morgan Corporate Emerging Markets Bond Index Broad Diversified; EUR HY: BofA Merrill Lynch European Currency High Yield 2% Constrained Ex Financial; IG Corp: Barclays Global Agg Corporate. Past performance is not a guarantee of future results. For illustrative purposes only.
Looking across the asset classes we can see negative returns for the first period ranging from at best -1.22% for European high yield to -23.67% for EMD local currency. For the second period we see positive returns ranging between 6.61% for US bank loans to 14.39% for US high yield. Further, in general those asset classes that fared worst during the sell-off – US high yield and EMD local currency – have performed best during the recent rally, although this is not a consistent pattern, with European high yield performing comparatively well during both periods, perhaps reflecting ECB corporate bond purchases. What does this tell us?
Correlations of credit risk across asset classes are increasing. As Figure 2 demonstrates, this appears to us to be a post financial crisis phenomenon, but it is one that is fundamentally supported by a shift in underlying credit quality, with a convergence between weakening investment grade credit quality and strengthening high yield credit quality over the post-crisis period (Figure 3). With a high degree of directional correlation evident across asset classes, setting a portfolio’s overall risk level has been a key component of the asset allocation decision.
Figure 2: Correlations with investment grade corporate credit
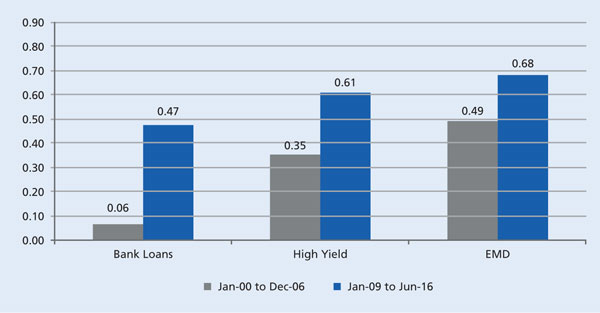
As of 30 June 2016
Sources: Barclays, Credit Suisse, Stone Harbor Investment Partners LP
1 The period from Jan-07 to Dec-08 has been excluded as we believe it is not representative of typical periods of volatility.
Performance reflects representative asset class benchmarks. HY: BofA Merrill Lynch US High Yield Constrained Index; EMD: J.P. Morgan EMBI Global Diversified; Loans: S&P/LSTA Leveraged Loan Index; EMDLC: J.P. Morgan GBI-EM Global Diversified; EMDCR: J.P. Morgan Corporate Emerging Markets Bond Index Broad Diversified; EUR HY: BofA Merrill Lynch European Currency High Yield 2% Constrained Ex Financial; IG Corp: Barclays Global Agg Corporate. Past performance is not a guarantee of future results. For illustrative purposes only.
Figure 3: Investment grade corporates and high yield corporates
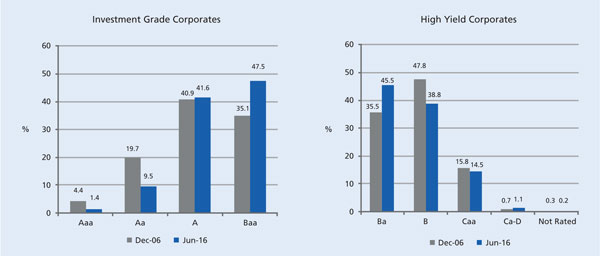
As of 30 June 2016
Sources: Barclays, J.P. Morgan, Stone Harbor Investment Partners LP
For illustrative purposes only.
The importance of setting the overall portfolio risk level is likely to remain a key component of the asset allocation decision but will require some surety that volatility will remain sufficiently high to reward such decisions. Increases in volatility signify greater uncertainty and generate a natural tendency to risk aversion – and with that wider spreads. Declining volatility reverses this process. As asset allocators, it is the changes in volatility that provide opportunity for adjustments to portfolio risk levels. In other words, we look for the volatility of volatility to be high. Figure 4 focuses on the volatility of volatility. We look specifically at the 50-day rolling volatility of the VIX, which is an index of implied market volatility on the S&P500 index and hence a good proxy for global systemic risk levels in our view. Post-financial crisis we have seen a significant jump in the volatility of volatility. In practical terms this materialises in the form of shorter periods of stable and often tightening spreads when volatility is declining, followed by more severe and frequent spikes in volatility and spreads when compared to, say, the mid 2000s.
Figure 4: Rolling 50 Day volatility of VIX
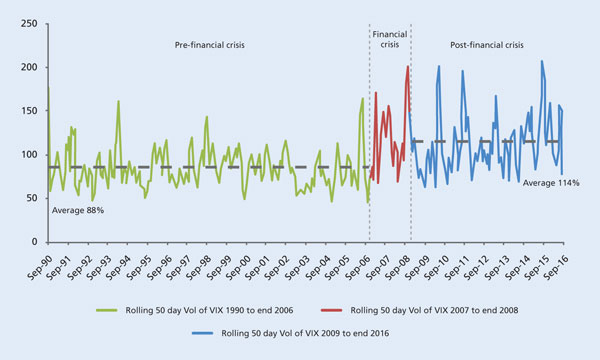
As of 29 September 2016
Source: Bloomberg
For full description of the VIX Index, please refer to the endnotes. For illustrative purposes only.
It is inevitably conjecture as to what has caused this but we would highlight a number of factors which are likely to cause this to persist.
- Investment grade assets are both lower rated and more volatile (credit return volatility) than pre-financial crisis, and with less implicit government support they are likely to remain so.
- Low nominal growth increases the risk of negative nominal growth, and therefore the inability of companies to manage nominal debt through a revenue downturn increases. This should leave spread volatility, if not spreads themselves, higher.
- Whilst monetary policy has sought to dampen these risks, the effectiveness of policy itself is likely coming into question, raising the prospect of increased uncertainty.
Sustained higher volatility in credit spreads and in financial assets in general argues for greater opportunities to move risk up and down through the investment cycle. One constant that remains is the tendency for volatility to mean revert, which provides further confidence when making asset allocation adjustments.
Beyond moving risk up and down, asset allocation across asset classes can reap strong rewards. Just adding the two periods together we can see that a continuous commitment to loans would have returned 3.84%, but a portfolio which moved from loans to US high yield at the turn of the markets would have returned 11.62%. Emerging market debt has often been viewed in a negative light over the past few years. This is really only the case if one focusses solely on EMD local currency where credit returns were -23.67% for the period end September 2014 to end January 2016. Whilst EMD hard currency lost some -5.84% over the same period, this was around half the losses of US high yield and, broadly speaking, on a par with US investment grade corporates. Since the end of January 2016 to the end of August 2016 EMD hard currency credit returns have been more than twice those of US investment grade corporates. Being in the right place at the right time is important, and the role of both top-down and bottom-up understating has been important in informing this decision.
Why would one have purchased US high yield in February 2016 when oil prices were falling and growth uncertainty rising? From a top-down perspective one could highlight wide spreads, some welcome monetary response from the ECB and BoJ, and high volatility which as we mentioned earlier tends to mean revert. But perhaps the most compelling argument came from a bottom-up perspective. Figure 5 highlights the distress ratio (option adjusted spreads in excess of 10%) for US high yield and shows it both with and without the Energy Metals & Mining (EMM) sectors. Distress in the market had reached levels seen in 2000-2003 but more importantly, bottom-up analysis highlighted that there was a similar level of distress (for which one can read fear) outside the EMM sector as there was for the market as a whole. Leverage levels had not spiked in the non-EMM sectors and debt service coverage remained strong. Combined with strong value indications and supportive top-down macro factors, the case for a move into high yield became evident.
Figure 5: US HY ex Energy/MM + Telecom Distress ratio (%)
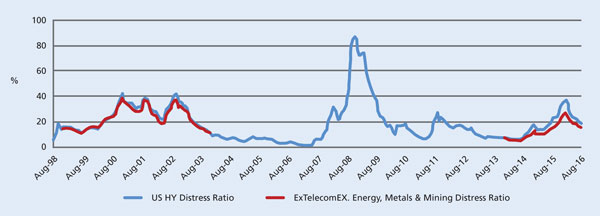
As of 31 August 2016
Sources: BofA Merrill Lynch
For full description of the BofA Merrill Lynch U.S. High Yield Master II Index, please refer to the endnotes.
For illustrative purposes only.
After the positive performance of the past few months, which have seen US high yield credit returns outperform other asset classes, the question must be asked, does value remain? From a top-down spread perspective US high yield looks attractive to us (Figure 6). Historically spreads have been below current levels for over 60% of the period from Oct 1990 to now.
Figure 6: Credit Suisse high yield index
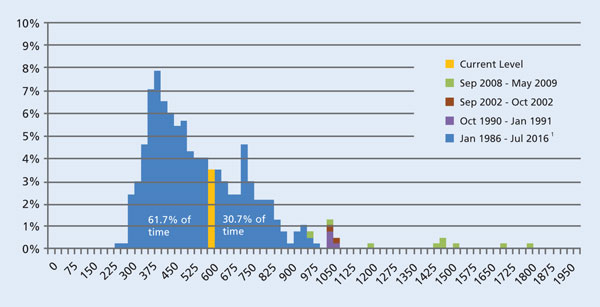
As of 31 August 2016
1. Represents entire history of spreads for this period, minus the spread history represented by other periods described above
Sources: Credit Suisse, Stone Harbor Investment Partners LP
Credit Suisse Leveraged Loan Index, please refer to the endnotes
For illustrative purposes only
The past few years have been rewarding for active asset allocators and have certainly provided much scope for active top-down management of portfolios. Underlying changes to the fundamental structure of markets and economies are likely to cause volatility to remain elevated. Whilst asset allocation decisions will remain a blend of science and art, they are likely to continue to play a very significant and perhaps increasing role in the management of multi-asset credit portfolios.
More Related Content...
|
|
|