Shifting down – coming to terms with a changing economy and slowing productivity

|
Written By: Subitha Subramaniam |
Subitha Subramaniam of Sarasin & Partners LLP notes the global slowdown in productivity which is occurring despite technological advances: this may be exaggerated by measurement issues, but urgently needs to be reversed
How do you measure a country’s potential? The year is 1931. It is the aftermath of the Stock Market Crash of 1929 and President Hoover is struggling to reverse the downward spiral in the economy. He has only sketchy information – stock prices, freight car loadings and incomplete data on industrial production – on which to base his policies.
The Bureau of Foreign and Domestic Commerce tasks Simon Kuznets to lead a team of economists to devise a more robust and timely measure of the economy’s pulse. After three years of exhaustive research, sifting through tax returns and payrolls data, Kuznets and his team come up with an estimate of the US economy called National Income – the first comprehensive measure of economic activity in the country. Armed with Kuznets’ empirical evidence on the state of the economy, President Roosevelt presents a supplementary budget to Congress in 1938, making the case for a big fiscal stimulus. The Great Depression finally draws to an end. Kuznets’ role in it remains a minor footnote, until much later in 1971, when he is awarded a Nobel Prize in economics for his decisive contributions to transforming economics into an empirical science.
Evolving the idea of National Income
Since Kuznets and his team computed National Income, the world has undergone an epoch of transformational change. Developed economies have endured wars and shifted away from manufacturing products to consuming and trading services. Now they are witnessing a dramatic rise in the digitalisation and consumption of information.
In the US, the Bureau of Economic Analysis (BEA) is tasked with ensuring that Gross Domestic Product (GDP – the successor to Kuznets’ National Income) keeps pace with the shifting economic landscape. And they have tried. Throughout the 1980s and 1990s, the BEA worked with IBM to incorporate accelerated improvements in the quality of goods, particularly technology goods. The result of their pioneering work was the introduction of hedonic adjustments, which treat quality improvements as an increase in real output.
Addressing the growing need for accurate growth estimates
In the new millennium the pace of change has continued to accelerate. As economies have shifted further towards services and information, there is growing unease over whether or not statisticians have been able to keep up with the pace of change. Now, as in 1934, we urgently need accurate information about the pulse of the economy. Why is this?
A country’s long-term potential is driven by two factors: the number of workers in an economy and the productivity of these workers (output per hour worked).
Together, they create the goods and services that show up as measured GDP. Weak economic growth is therefore an outcome of either low productivity growth, weak labour force growth or both.
In an ideal world, we would estimate GDP by multiplying the number of workers in the economy with their productivity. In practice, however, productivity is difficult to measure. It is instead estimated by dividing measured GDP by the number of hours worked. Productivity, the most important driver of a country’s long-term potential, is therefore highly dependent upon measured GDP. Erroneous estimates of GDP can lead to faulty estimates of productivity and give a misleading view of the economy.
GDP growth following the financial crisis has been surprisingly weak. In part, this has been because labour markets have exhibited hysteresis – or deep scarring as a result of the crisis. This is particularly true in the US, where labour force participation rates have fallen sharply. In 1965, 19 out of 20 American men between the ages of 25 and 54 were employed. Fifty years on, that number is 17.
Low productivity growth also appears to be holding back economic growth. Since the financial crisis, productivity growth, as measured from GDP, has been running at half the rate of the 1990s and early 2000s. Given the many apparent dramatic improvements in technology that are enhancing consumers’ daily lives, many question whether the slowdown in productivity is genuine or whether statisticians, unable to keep up with the rapid changes in the structure of the economy, are underestimating GDP and hence productivity.
Changing economic structures make for statistical challenges
Certainly, the structure of economies has undergone dramatic change in recent years. Increasingly, we live in an information age, where many technology companies are using disruptive business models to provide information and other services to consumers for free. Although such business models improve consumer welfare, they have a decidedly negative impact on measured GDP.
Take the case of Wikipedia, the free encyclopaedia, which has disrupted the sale of physical encyclopaedias and other reference books. Today, as the sale of such books disappear from GDP, they are being replaced by free transactions of zero value. Similarly, Skype and other forms of free telephony have dramatically reduced the demand for paid telephony. As paid international calls are replaced by free calls, GDP takes a negative hit. The same could be said of free Google and Apple maps, which have dramatically reduced the purchases of GPS machines made by companies like Garmin.
Free services have undoubtedly benefited consumers’ balance sheets but are hurting GDP. Over time, consumers may make use of their increased purchasing power to buy other goods and services and boost GDP. Yet, for now, this does not appear to be happening. Instead, the provision of free goods and services is leaving a void in GDP, estimated by some economists to be around 0.2% – 0.5% annually.
A further challenge for statisticians is the ongoing shift towards a service-based economy. In 1960, 28% of the US labour force was involved in manufacturing. By 2014, that number had more than halved. Today, the service sector accounts for more than 78% of the US and UK economies. As services have grown in importance, so too have the difficulties associated with estimating their output, and hence productivity.
Take banking, healthcare, legal and education and personal services, which account for more than a quarter of GDP in most countries. Output in these sectors is estimated by inputs, most often by the number of employees. Not only is output in these sectors difficult to estimate, improvements in quality of output are particularly challenging. It is far easier to model the improvements in the quality of technology goods than the improvements in the quality of a heart operation. Larry Summers, the former Treasury Secretary of the United States, recently argued that measurement problems in the healthcare sector alone could be biasing GDP downwards by some 0.75%.
Figure 1: Average annual growth rates of output per hour and its components, selected intervals, 1820-2014
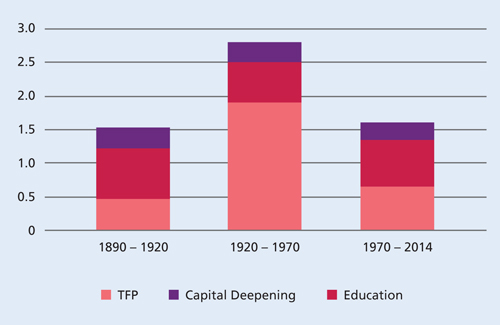
Source: Peterson Institute for International Economics
Assessing the drivers of productivity
Mis-measurement of GDP is possibly exaggerating sharp declines in productivity. Nevertheless, productivity growth, particularly if broken down into its component parts, appears to be on a secular downward trend. Figure 1, above, shows the long-term evolution of the three key drivers of labour productivity – education, capital investment and technical progress (improvements in production technology). From the chart, it is clear that all three drivers of productivity, particularly investment and technical progress, have been weak.
Investment over the past decade has been inexplicably low, despite record profits and low borrowing costs. Businesses have been reluctant to invest, preferring to buy back shares and return capital to shareholders. Moreover, business dynamism, as measured by the number of firms entering and exiting the market place, appears to be on a downward trajectory. Perhaps incumbents, fearing disruption from low cost start-ups from technology-enabled firms or emerging market competitors, have become risk averse? There are no clear answers, but the fact remains that net investment in the economy remains low, and this has clearly been a drag on worker productivity.
Technical progress also appears to have slowed down in recent years. Recent innovations appear to have materially improved consumer welfare, but have yet to impact business efficiency. Robert Gordon, from Northwestern University, argues that the predominant use of Big Data has been in marketing, which is essentially a zero sum game. Yet others argue that there is typically a big lag between innovation waves and increases in productivity. The world economy is due a surge in labour productivity. Both, however, agree that the pace of technical progress in the current decade is lower than in previous ones.
Facing up to lower productivity, and its impact on investment returns
For long-term investors, coming to grips with the slowdown in productivity is possibly the most important factor for investment returns. Today, despite an information revolution that is materially raising consumer welfare, the world economy appears to be in the midst of a marked slowdown in productivity growth.
Only time will tell whether the lull in productivity growth is temporary. Measurement issues are possibly exaggerating this slowdown. Nevertheless, unless this slowdown is reversed, it will lead to a future of lower economic growth, lower corporate profits and lower investment returns. We will be closely monitoring this when making our own projections for long-term investment returns.
More Related Content...
|
|
|