Roger Merz and Thomas Schaffner of Vontobel Asset Management look at the outlook for active investors in China’s equity markets,...


June 1, 2022
Report

|
Written By: Neil Robson |
Neil Robson of Columbia Threadneedle Investments examines the challenges and opportunities offered by a rapidly evolving global economic landscape
Global warming is never far from the headlines, but it affects more than just the climate: it also has profound implications for economic change. This is especially relevant when it comes to China. Figure 1 below provides a stark illustration of the rise in global surface temperature relative to 1951-1980 average temperatures. But in Figure 2 (over) we can see that China’s rapid path to industrialisation has culminated in an apparent peak in CO2 emissions. While this may be good news on the face of it, those levels still represent cause for concern, both at an international and domestic level.
Figure 1: The heat is on
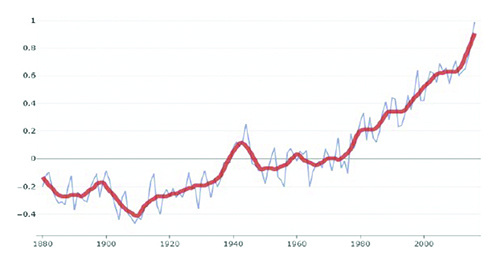
Chart shows the Global Land-Ocean Temperature Index (change in global surface termperature relative to 1951-1980 average temperatures.
Source: NASA’s Goddard Institute for Space studies, 2017
Figure 2: Are China’s carbon dioxide emissions peaking?
Chart shows carbon dioxide emissions (millions of tonnes).
Source: Berenberg Thematics, Frankfurt school / UNEP Centre / Bloomberg New Energy finance, 2016 – Global Trends in Renewable Energy Finance
“One Belt, One Road”… one vision?
In October 2017, President Xi Jinping used a three-and-a-half hour speech to set out his vision for a “beautiful China” – one where a cleaner environment is underpinned not just by the quantity of economic growth, but by its quality. To achieve these goals, China’s first option is to move up the value chain by focusing on the manufacturing of more value-added products and outsourcing the production of lower value-added products. The left-hand chart in Figure 3 (over) shows annual research and development (R&D) expenditure by China and Japan within the top 1,500 companies globally, demonstrating that boosting R&D spending has the power to drive a significant shift up the value chain.
Figure 3: China’s R&D & exports
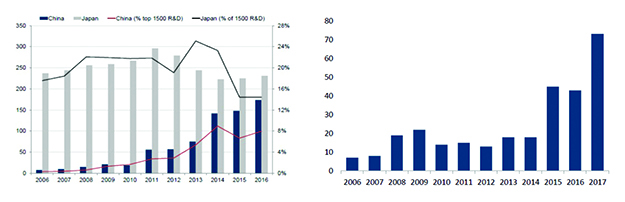
Left-hand chart shows the number of companies and their share of R&D spending within the top 1,500 R&D spenders globally. Right-hand chart shows China outbound deals to Asia-Pacific ($US billion).
Source: Europena Commission, IRI, Economic of Industrial Research, Goldman Sachs Global Investment Research, Berenberg Thematics 2017. Outbound deals rounded to nearest $USbn.
The second way in which China can drive economic growth is to export some of its polluting capacity to other countries. This is where the “One Belt, One Road” programme will play a crucial role (right-hand chart, Figure 3). The future of trade in Asia will depend heavily on China’s much-vaunted new Silk Road initiative, the economic programme set to pump massive investment into the development of trade routes in the region. (The “belt” is the land-based road that runs all the way from China through to Scandinavia; the “road” is the maritime Silk Road – the shipping lanes that stretch from China to Venice.) This programme will see China striving to balance the imperative to reduce pollution with the need to ramp up industrialisation and extend its influence through the whole of Asia and beyond.
Fiercer competition from Chinese corporates
What does this mean for Western companies? When it comes to their profitability, the main threat will come from increased competition from Chinese corporates. Take the US, which has had an unfair competitive advantage for the past 100 years. With a population of around 290 million, US companies have the freedom to amortise their advertising and product development costs on a huge domestic market.
Yet while the US economy is now worth $20 trillion, China is hot on its heels at $14 trillion, and Asia ex-Japan comes in at a huge $21 trillion. We expect to see China increasingly take advantage of that quasi-domestic market scale in order to move up the value chain and expand the scope of its influence. For example, while we are used to buying Korean and Japanese cars, we can expect to be buying Chinese cars in 10 years’ time as China capitalises on its excess capacity and quality continues to improve.
Tech crosses over
Our second key trend is the sheer scale of the crossover of tech into multiple, diverse industries. Google provides a striking example: spin-off firm Waymo is gearing up to launch its first driverless ride-hailing business in Arizona, presenting a serious challenge to the likes of Uber. Driverless cars are widely seen as the silver bullet that can make ride-hailing profitable by stripping out the main cost: the wages paid out to human drivers. If Waymo manages to successfully monetise the operating system for autonomous vehicles themselves, it could potentially remove all the profitability and value chain out of today’s car industry – without manufacturing a single vehicle.
Figure 4: Disruptors are growing their physical scale
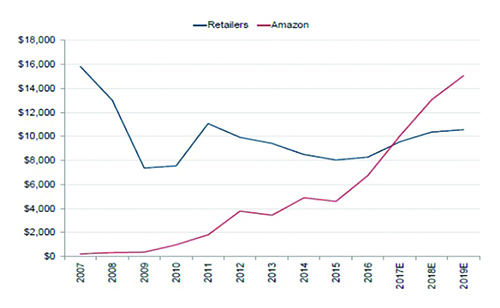
Chart shows the capital expenditure of sectors ($US million).
Source: Company data, Goldman Sachs Global Investment Research, Bloomberg, Jefferies Research, 2017. Note: Seven largest retailers by 2010 capex: Target, Lowe’s, Home Depot, Inditex, Kohl’s, Best Buy, TJX. 2017-19 capital expenditure based on estimates.
Across the board, tech companies are increasingly using data and artificial intelligence to gain insight into other businesses that could make their own more competitive. Artificial intelligence is developing at pace, driving forward technologies like the voice recognition deployed in Amazon’s Echo.
The red line in Figure 4 shows the amount Amazon is spending per year on capital expenditure; the blue line shows the capex of the next seven largest retailers in the world. This highlights the idea of a tipping point: while tech represents around 15% of world market cap, its impact also extends to the other 85%.
In Figure 5, meanwhile, the sheer scale of the mega tech stocks is clear to see: the combined capex of Amazon, Google, Microsoft, Apple and Facebook is close to $100 billion. But adding in the two Chinese players, Tencent and Alibaba, creates a seven-strong cohort of companies that represent a staggering 8.67% of the MSCI World market cap. And this year, those companies are set to build their revenues in excess of $200 billion, profiting by an incremental $40 billion.
Figure 5: The mega stocks are growing too
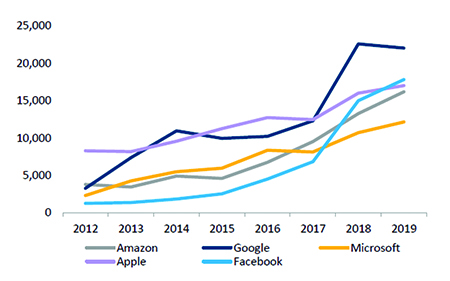
Chart shows capital expenditure across mega stocks
Source: Company data, Goldman Sachs Global Investment Research, Bloomberg, Jefferies Research, 2017.
Millenials don’t break the rules like they used to
Our third key trend is changing consumer behaviour among millennials (Figure 6, over). Recent years have witnessed a huge shift, as shown by revealing data on drinking, smoking and driving for US teenagers, with more of them “following the rules”. At the same time, homeownership among the UK’s 25-34-year-olds has also fallen by 25% points between 1981 and 2016 as young people have increasingly rented rather than bought. And both trends have tangible economic consequences.
Figure 6: Young people follow the rules … but have it tough
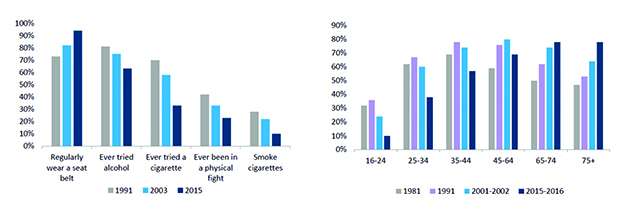
Left-hand chart shows “the percentage of US teenagers who …”; the right-hand chart shows the percentage of each age group that are homeowners in England.
Source: Youth Risk Behaviour Survey, CDC, 2016. English Housing Survey, ONS, 2017. All figures rounded to the nearest percentage point.
Meanwhile, TV subscriber numbers in the US – another key indicator of consumer trends – are collapsing as services like Netflix win market share and young people shun TV in favour of e-sports (Figure 7). And because advertising dollars follow viewership, declines in TV subscribers could be met with a corresponding rise in revenues for the video game companies of the future.
Figure 7: Traditional models suffer as a generation unsubscribes
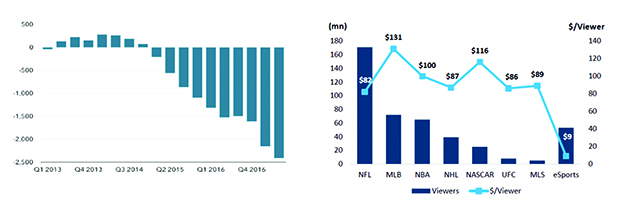
Left-hand chart shows year-on-year traditional pay TV subscribers in the US (000s); right-hand chart shows the estimated revenue per viewer in the US (except eSports) based on global revenues and viewership; revenue and dollars per viewer rounded to the nearest million and dollar respectively.
Source: Company data, Jackdaw Research, 2017. Barclays Research, 2017. *Based on global revenues and viewership. Revenue and dollars per viewer rounded to the nearest million and dollar respectively.
Big and small are prospering
More than 1% of global GDP now passes through the ecosystems of Amazon and Alibaba – a figure that is growing at around 30% per annum (Figure 8, left-hand chart). Combined with the capex figures discussed earlier, competitors of these companies should be seriously worried.
Figure 8: Dominance of big tech … but smaller manufacturers grab market share
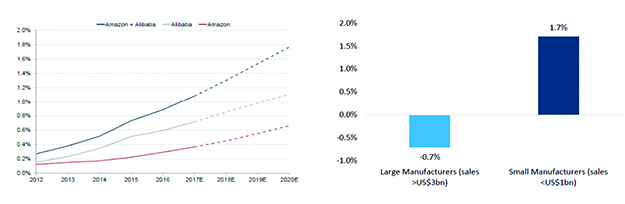
Left-hand chart shows the global gross merchandise value as a % of world GDP. Right-hand chart shows the market share change (%) in the packaged foods industry (2009-2012).
Source: IMF, Haver Analytics, company data, Goldman Sachs Global Investment Research, Euromonitor 2017.
But it’s not just big tech that demonstrates the changing consumption patterns of millennials. The past few years have seen a huge surge in the popularity of craft beers and gins. Smaller manufacturers are gaining market share at the expense of larger manufacturers in the packaged goods market (Figure 8, right-hand chart). The driver behind this shift? The small-scale manufacturers aren’t spending a fortune on TV advertising campaigns; instead, they are successfully leveraging the power of social media to promote their products and communicate their brand messaging.
An interesting example here is Gillette. Every other year, Gillette used to add another blade to its razor products and would charge a higher price for it. But while the company boasted a 70% market share in the US, that figure has now fallen to 54%. Competition has come not from supermarket shelves, but from innovative interlopers like Dollar Shave Club who provide direct-to-consumer subscription services and drive their messages through social media.
Another case in point is the well-documented collapse of Blockbuster. Figure 9 shows the Pavlov’s dog-type reaction of the share price as investors rushed to buy the stock because it was “cheap”, only to panic at the next profit warning until there was no value either in the shares or in the business.
Figure 9: BB Liquidating (formerly Blockbuster) share price
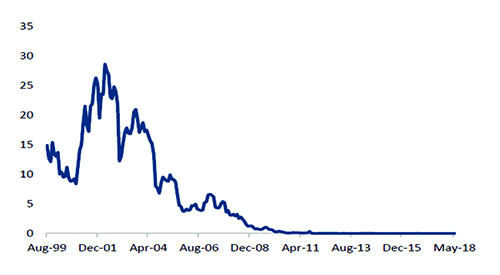
Source: Bloomberg, Columbia Threadneedle Investments, as at 31 May 2018.
Back in 1942, the Austrian economist Joseph Schumpeter wrote about “creative destruction”, the “process of industrial mutation that incessantly revolutionises the economic structure from within, incessantly destroying the old one, incessantly creating a new one.” We are now living in a period of staggeringly rapid change, sweeping change to business models, and a breathtakingly large-scale crossover of tech into many other industries taking place. And it’s vitally important that we, as global equity investors, understand these trends and their impacts on corporates across industries.
For more than a decade, growth stocks have outperformed value stocks, partly due to the economic impact of the global financial crisis. But the main reason is the seismic shift in the value curve of many industries which is enabling the tech companies to take a growing share of the value chain.
When we look to invest in a stock we scrutinise the quality of the business and the sustainability of its competitive advantage, typically focusing on businesses with high returns on investor capital that have the power to grow faster than the marketplace. And if those barriers to entry and competitive differentiators are significant enough, the business should be a sustainable one – and an attractive target for investment.
Important information
For investment professionals only, not to be relied upon by private investors. Important Information: Past performance is not a guide to future performance. Your capital is at Risk. The value of investments and any income is not guaranteed and can go down as well as up and may be affected by exchange rate fluctuations. This means that an investor may not get back the amount invested. The mention of any specific shares or bonds should not be taken as a recommendation to deal. This document is not investment, legal, tax, or accounting advice. Investors should consult with their own professional advisors for advice on any investment, legal, tax, or accounting issues relating to an investment with Columbia Threadneedle Investments. The analysis included in this document has been produced by Columbia Threadneedle Investments for its own investment management activities, may have been acted upon prior to publication and is made available here incidentally. Any opinions expressed are made as at the date of publication but are subject to change without notice and should not be seen as investment advice. This document includes forward looking statements, including projections of future economic and financial conditions. None of Columbia Threadneedle Investments, its directors, officers or employees make any representation, warranty, guaranty, or other assurance that any of these forward looking statements will prove to be accurate. Information obtained from external sources is believed to be reliable but its accuracy or completeness cannot be guaranteed. Issued by Threadneedle Asset Management Limited. Registered in England and Wales, Registered No. 573204, Cannon Place, 78 Cannon Street, London EC4N 6AG, United Kingdom. Authorised and regulated in the UK by the Financial Conduct Authority.
Columbia Threadneedle Investments is the global brand name of the Columbia and Threadneedle group of companies.
columbiathreadneedle.com. 2172147
|
|
|