Why country allocation matters

|
Written By: Stephen Way |
Stephen Way of AGF Investments looks at how investors can identify inefficiencies and build a framework to take advantage of opportunities globally
In this era of economic globalisation and increasingly correlated markets, investors may be wondering if borders matter when it comes to global investing. In particular, can a country allocation framework uncover global opportunities? We believe the answer is a resounding yes. In fact, despite the globalisation of financial markets, we consider stock markets to be inefficient. This inefficient global allocation of assets suggests that a country allocation framework is an excellent approach to investing in global markets – provided an investor focuses on the right factors. A disciplined, systematic multi-factor approach to country allocation can help identify market inefficiencies and contribute substantially to outperformance over a full market cycle.
Country selection currently explains a quarter of returns
Although economic integration and globalisation have reshaped the global economy in the last 20 years, country selection has remained a significant source of alpha generation in global portfolios. On average, from December 31, 1970 to December 31, 1998, country selection explained approximately 34% of returns (see Figure 1). Since the Eurozone’s overnight adoption of the euro in 1999, on average, country selection has represented about 20% of returns over the past 15 years (period ending December 31, 2014).¹ While the importance of country selection has experienced a modest decline since the adoption of a common currency helped break down some financial borders, it is important to note that country selection still represented about 24% of returns as at December 2014.
Figure 1: Importance of country, sector and industry in explaining company returns 1971 through December 31, 2014
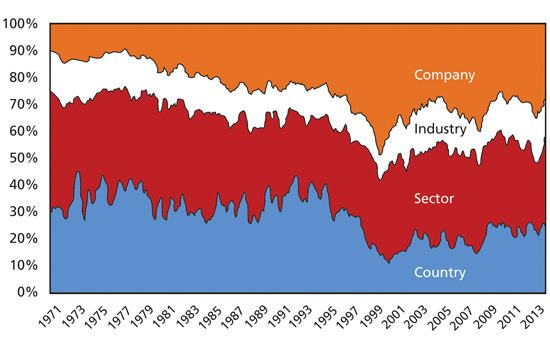
Source: MSCI All Country World Index (ACWI), Bernstein Research. As of December 31, 2014
Another analysis done on country allocation from 2001-2005 found that on a month-to-month basis, country allocation explained 88% of fund return variation and, over longer holding periods, explained 34% to 50% of the variance in excess returns.² These various studies point to a similar conclusion – that country allocation is an important factor to take into account when investing globally.
Inefficient markets: home-country bias
We recognise that multiple factors contribute to the pricing of global markets including but not limited to monetary policy, a current account deficit or surplus, politics, money flows and economic growth. Overall, we believe global markets are inefficient and one of the significant drivers of this phenomenon is home country bias. Even today, despite decades of encouragement to seek out the wide variety of diversification benefits available from investing globally, investors still prefer to keep their money close to home. And this is not just the case for retail investors. The home-country bias trend is also being played out by some of the world’s biggest pension plans as they maintain hefty allocations to their own markets, albeit less than it was in the late 1990s (Figure 2). There are a number of reasons investors focus on domestic stocks including: improved and accessible information, regulatory requirements, overconfidence about their markets’ prospects for good returns or a lack of knowledge about foreign markets. Whatever the reason behind this behaviour, a large number of investors will continue to invest close to home while potentially disregarding the overall attractiveness relative to other global markets.
Figure 2: Pension asset allocation – domestic equity exposure (1998 – 2014e)
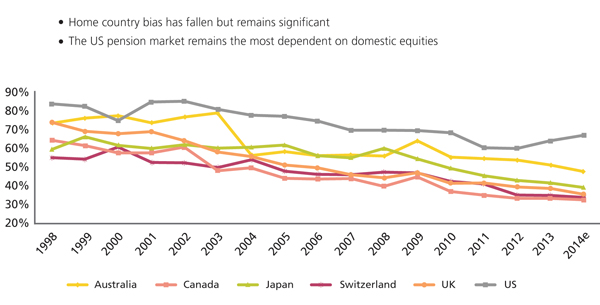
Source: Towers Watson Global Pension Assets Study, February 2015
Note: The Netherlands is not considered
Persistent home-country bias has the potential to create inefficient stock markets which can lead to sustained periods of over or undervaluation and mispricing. This can in turn create opportunities for investors that have the skill to identify underpriced markets with attractive valuation, growth and risk attributes.
Outperformance: it’s not about economic growth
Identifying which countries will outperform is more difficult than some investors believe. For example, many still think that a country’s GDP growth, which captures a host of economic information, is the most important indicator that a particular country’s stock market will do well. However, historical data has shown that economic (GDP) growth only explains a very small proportion of actual performance (R2=0.09)³ and there is a very limited relationship between the two (Figure 3). The regression actually shows a slightly negative relationship, meaning that when real GDP growth was higher, real equity returns have been marginally lower.
Figure 3: Real GDP growth versus real equity returns (1969-2009)
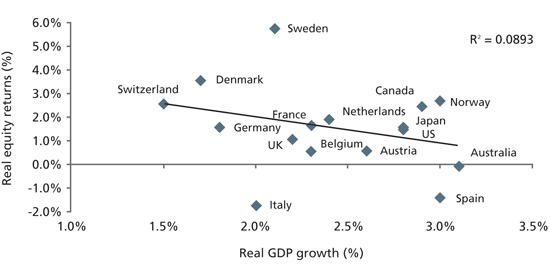
Source: MSCI Barra. From Societe Generale’s Cross Asset Research Report “Country selection – as GDP growth is irrelevant, what should we use instead?” dated April 2011
The data for emerging markets shows a slightly different picture, with a regression showing a slightly positive relationship this time, but even less significance (R2=0.03) when comparing annual real GDP growth to each year’s market returns in BRIC countries from 1996 to 2012 (Figure 4). The bottom line: whether in developed or emerging economies, economic growth and equity returns have a very limited relationship.
Figure 4: Comparison of total net return of BRIC equity market indexes to real GDP growth (1996-2012)
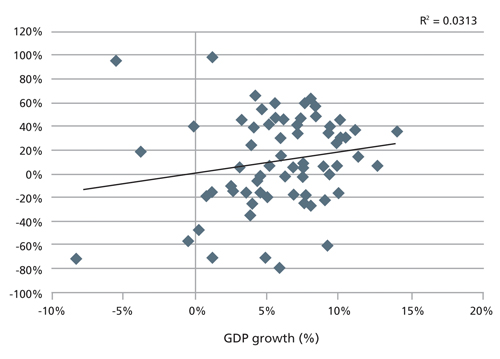
Source: IMF, Bloomberg and Commonfund as of December 31, 2012
One potential reason for this limited relationship is that local stock markets may not be representative of the local economy. For example, the UK stock market is filled with global multinational firms that operate worldwide. The top five companies in the FTSE 100 Index at the end of 2014 were HSBC Holdings PLC, Royal Dutch Shell PLC, BP PLC, GlaxoSmithKline PLC and British American Tobacco PLC, all global firms with significant foreign operations. Yet, global profits for such big companies don’t necessarily reflect prosperity at home, a fact that might explain why a country’s economic growth may have a low correlation with its stock market returns.
Drivers of returns: momentum and value
We have also found that over a longer time period, paying attention to valuation, growth/momentum and risk characteristics helps identify global stock markets that could outperform. For example, price-based indicators, including value and momentum factors, are some of the most helpful in generating alpha. A basic global portfolio strategy that bought the cheapest countries on a price-to-book basis and shorted the most expensive ones would have outperformed by over 600 basis points per year since 1975 (rebalanced annually). Among several other price-based indicators, price/book and price/earnings have all been significant contributors to alpha since 1975 (see Figure 5). Investors can infer that a framework or methodology that includes these types of factors can generate additional alpha.
As indicated in Figure 5, one driver of alpha is perfect foresight of a company’s earnings which we believe is unrealistic and therefore an unreliable predictor. Furthermore, on a trailing basis, profits do not generate alpha and, as discussed earlier, there is little correlation between GDP growth and stock market returns, whether on a trailing or forward looking basis.
Figure 5: Country allocation using profits, GDP, momentum and valuation (annual rebalancing)
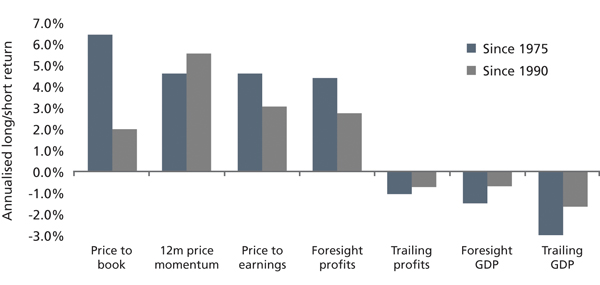
Source: MSCI Datastream. From Societe Generale’s Cross Asset Research Report “Country selection – as GDP growth is irrelevant, what should we use instead?” dated April 2011
Country allocation using momentum and valuation
In order to gain access to the one-quarter of returns explained by country selection an investor needs to use an empirically-verified process that ranks and identifies the best opportunities available. In addition to testing these factors, any recommended allocations derived from a framework must be evaluated within the context of the political and economic environment.
We favor a multi-factor country allocation framework that incorporates time-tested valuation, growth/momentum and risk measures. These measures include price to book, price to earnings, price momentum, beta and other factors that have each been tested for their ability to add value for our investors.
In our view, country allocation should not be based on macroeconomic factors, but rather a process of identifying attractive stock markets. This works particularly well in our MSCI ACWI investment universe, as it contains a wide variety of markets and returns are widely dispersed (see Figure 6). In 2013 alone, Greece delivered the highest returns of +51.1% while Peru delivered the lowest returns of -29.8%. The wide range in returns (80.9%) and wide deviation in returns (19.8%) points to a significant opportunity for investors that can allocate between the numerous markets in the world (45 stock markets in the ACWI at end of 2013).
Figure 6: Dispersion of country annual returns
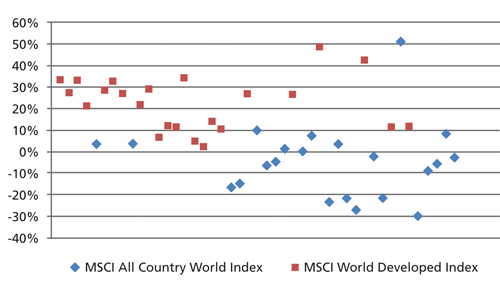
Source: Bloomberg, as of December 31, 2013. Returns in USD
A country allocation framework would not work as well in an investment universe with a more homogeneous group of countries, such as the MSCI World Index. All its constituent developed markets returns were positive last year and posted a smaller range of returns (46.1%) and lower deviation (12.3%), ranging from a minimum of 1.7% to a maximum of 47.8%. Casting a wider net on global markets can help identify greater opportunities (Figure 6).
We believe that over time, valuations should ultimately demonstrate reversion to the mean as one market will not be perpetually more expensive than another. Markets that have become cheap (e.g. as a result of overzealous selling) will eventually normalise and gain in value and expensive markets will become cheaper over time. However, markets can remain cheap for significantly long periods of time (Figure 7) and by including factors such as price momentum and EPS revisions, one can avoid being caught in the value trap.
Figure 7: Valuation: A key indicator of a stock market’s attractiveness
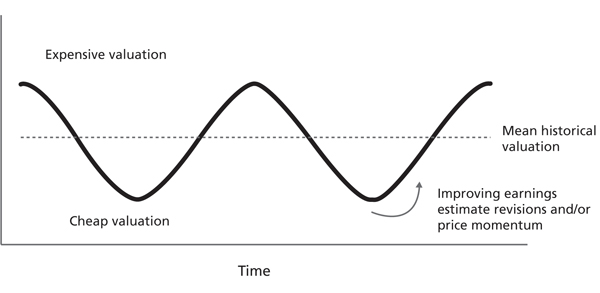
Source: AGF Investments Inc. for illustration purposes only
Any framework should pay attention to risk and include an analysis of market beta, which incorporates volatility and correlation. We favor stock markets with low betas (which implies low volatility and/or low correlation) and this usually leads us to overweight those stock markets, thereby reducing risk while improving overall diversification.
Figure 8: Beta of major world indexes vs. the MSCI ACWI
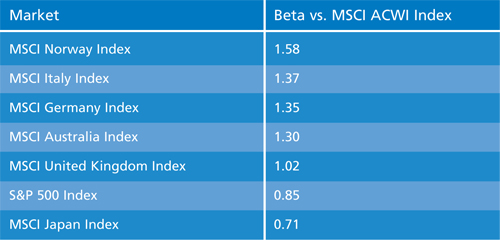
Source: Bloomberg, for the 10-year period ending December 31, 2014 using monthly returns
It is also important to pay close attention to a country’s current account balance, which is particularly critical when investing in emerging markets. Those countries with meaningful current account deficits may face funding challenges from time to time, thereby increasing the overall risk of investing in those countries.
It is clear that country allocation can play a pivotal role in generating alpha. By using a multi-factor country allocation framework that incorporates time-tested valuation, growth/momentum and risk measures, investors can uncover the many opportunities that global investing has to offer.
The commentaries contained herein are provided as a general source of information based on information available as of August 2015 and should not be considered as personal investment advice or an offer or solicitation to buy and/or sell securities. Every effort has been made to ensure accuracy in these commentaries at the time of publication, however accuracy cannot be guaranteed. Market conditions may change and the manager accepts no responsibility for individual investment decisions arising from the use of or reliance on the information contained herein. References to specific securities are presented to illustrate the application of our investment philosophy only and are not to be coexpnsidered recommendations by AGF Investments. The specific securities identified and described in this presentation do not represent all of the securities purchased, sold or recommended for the portfolio, and it should not be assumed that investments in the securities identified were or will be profitable.
AGF Investments is a group of wholly owned subsidiaries of AGF Management Limited, a Canadian reporting issuer. The subsidiaries that form AGF Investments manage a variety of mandates comprised of equity, fixed income and balanced assets. AGF International Advisors Company Ltd. is authorised by the Central Bank of Ireland and regulated by FCA for conduct of business rules in the U.K.
1. Based on rolling 12 month average returns
2. Bear Stearns Asset Management, May 2006
3. The R2, also known as the coefficient of determination, typically ranges from 0 to 1. A value of 1 indicates that the regression or linear approximation fits the data well, and that a strong linear relationship could exist between the variables. A value of 0 indicates otherwise.
More Related Content...
|
|
|