Emma Powell explores the recent historical performance of investment in private equity, concluding that schemes may need to moderate their...

Report
Published: February 1, 2020

|
Dr. Andrea Carnelli-Dompé |

|
Andy Bush |
Pantheon’s Dr. Andrea Carnelli-Dompé and Andy Bush discuss three research projects designed to support a successful investment approach
Private equity data is still relatively scarce, complex and inaccessible, so we believe it is sometimes difficult to substantiate bold statements around how to construct an optimal portfolio. For instance, while most investors might agree that some level of diversification is sensible, does that mean a five-fund or a 50-fund portfolio is sufficient? At what point does a private equity fund portfolio become a passive “index tracker”, or lead to over-diversification? Similarly, is it in fact true that smaller private equity companies perform better than larger ones, and does one truly need to access the mid-market to generate alpha? Or how important is a manager’s track record when considering a new commitment; how likely are top-quartile returns, or bottom-quartile for that matter, to be sustained from one fund to the next, and what emphasis should be placed on qualitative versus quantitative factors, when determining future outcomes?
Of course, scrutinising the historic data doesn’t necessarily provide all the answers, but we believe it can help inform and support an investment strategy for private equity. Pantheon’s research team has conducted analysis on the following topics, the key findings of which we summarise in this article.
1. How many funds represent an optimally-diversified private equity programme?
We considered this question from the perspective of a fund-of-funds manager who would typically aim to build a single portfolio over a three-year period and invest across a range of sub-stages and regions. Our objective was to determine the number of funds required for the optimally-diversified portfolio, based on an analysis of historic data.
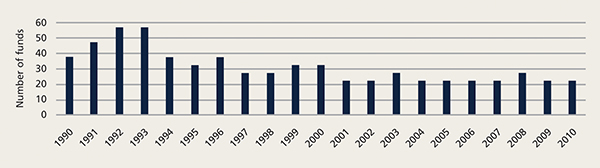
Our study utilised the Preqin dataset and captured all commingled buyout, growth, venture and turnaround funds from the US, Europe and Asia/ROW with vintages spanning 1990-2013 (more recent vintages were excluded owing to their immaturity). A few features of the dataset are worth mentioning. Firstly, as shown in Figure 1, the number of funds in each vintage increases significantly over time, commensurate with the growth of the asset class as a whole (although there are notable dips in the early 2000s and in the aftermath of the global financial crisis). Secondly, as shown in Figure 2, the average performance stabilises around the 1.5x to 2.0x (on a TVPI basis1) from the mid-1990s both on an absolute and “size-weighted” basis; the size-weighted mean return effectively represents a passive index of private equity funds. Thirdly, there is a marked dispersion of returns, as indicated by the spread between the 25th and 75th percentiles, although this spread does narrow over time.
Figure 1: Number of underlying funds in sample by vintage
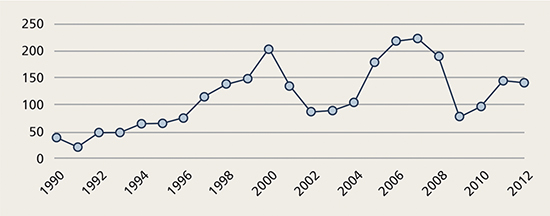
Source: Preqin data as of December 2018
Figure 2: Performance of underlying funds by vintage
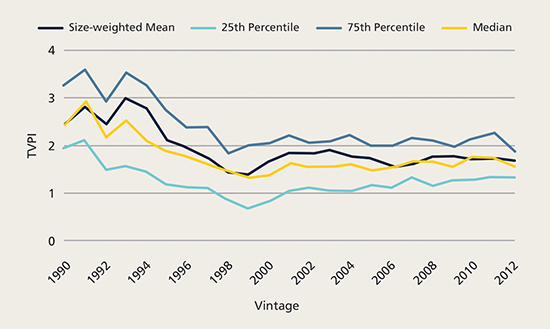
Source: Preqin data as of December 2018. Past performance is not a guarantee of future results.
To answer the question, we needed to determine what level of active risk is optimal and to analyse the effect of diversification on active risk. This is complicated as active risk can be influenced by both the number of funds and the dispersion of returns, which vary for each vintage year. We analysed the time-varying relationship between portfolio size (i.e. number of funds) and active risk via Monte Carlo simulations2, running over 3,000 experiments for all vintages between 1990 and 2011 and for a variety of portfolio sizes from five to 150 funds.
Figure 3: Active risk by vintage
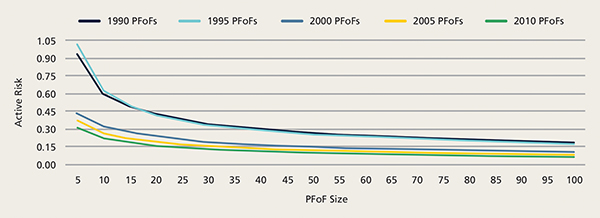
Source: Pantheon analysis based on Preqin data
Figure 4: Optimal Private Equity Fund of Funds size by vintage
Source: Pantheon analysis based on Preqin data
The results revealed two key patterns, as indicated in Figure 3. Firstly, portfolio size impacts active risk, but the effect is non-linear and becomes marginal as the portfolio size increases. Secondly, portfolio vintage risk is a key driver of active risk, and recent vintage years can achieve much lower levels of active risk at the same portfolio size as older vintages (which one would expect given the narrowing performance dispersion over time). To determine the optimal portfolio size, we asked at what point the addition of five funds yielded less than 0.02x reduction in active risk, i.e. when the reduction in risk became immaterial. Figure 4 presents the results for each vintage year. For a global and multi-sub stage fund-of-funds solution investing over three years, the implication is that a 20-25 fund portfolio is optimally diversified. Beyond that number, little diversification benefit is derived, and the prospect of top-quartile returns diminishes.
2. Do small- and mid-market buyouts outperform large and mega buyout transactions?
To provide some substance behind this often-touted claim, we used Pantheon’s own data on buyout deals executed in the period 2000 to 2012; and classified small/mid and large/mega buyouts as transactions with enterprise value, at time of acquisition, below and above $500 million respectively. There was a total of 2,237 transactions in the data set, 1,277 in the small and mid-space and 960 in large and mega. The analysis showed that small- and mid-buyout deals outperformed their larger peers by a TVPI compounded annual growth rate of (CAGR) of 5%.
There are a several qualitative factors that support the statistical evidence that small and mid buyouts outperform, and these are also worth highlighting. Firstly, for smaller companies there is generally wider scope for operational improvements, which in fact represent an ever-increasing share of value-add for PE deals (see Figure 5). Smaller companies typically have fewer resources, less experienced management teams and inefficient processes. In other words, there is significant room for improvement. The same value creation levers may be present in larger and more developed companies, but some of these actions may already have been implemented, especially in the case of larger companies that have been the subject of previous private equity buyouts.
There is also a considerably larger opportunity set in the small and mid space, as shown in Figure 6, and a greater opportunity for managers to adopt a sector-focused strategy. In an increasingly competitive private equity environment, a manager’s ability to demonstrate deep expertise in a focused field has become a key differentiating factor for certain managers, particularly in the small- and mid-space, and such specialism seems to be bearing fruit.
Small and mid buyouts also typically offer more attractive entry valuations, as shown in Figure 7. As mid-market companies expand, we believe this provides the opportunity for greater multiple expansion at exit.
Figure 5: Contribution of value creation in private equity deals
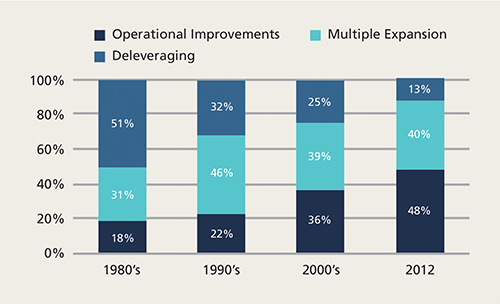
Source: Analysis by Boston Consulting Group based on 1980-2012 deals data. The analysis is cut off at the 2012 vintage as later deals may not be mature enough to draw meaningful conclusions.
Figure 6: Private equity deals by size
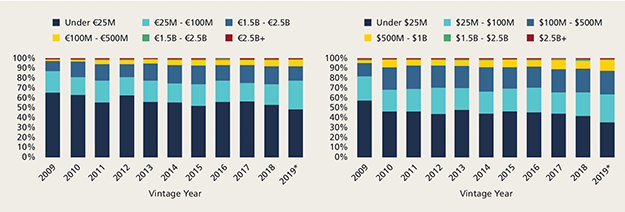
Source: PitchBook. * As of June 30, 2019
Figure 7: US transaction valuation multiples by deal size, (EV/EBITDA)
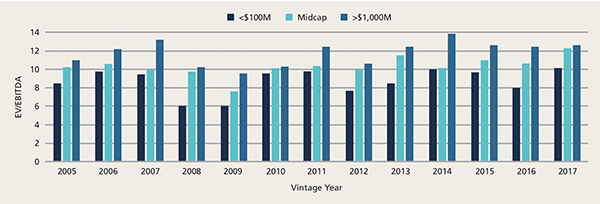
Source: Analysis by Dealogic and William Blair on transactions from 2005 to 2017.
It’s not all good news though for small and mid buyouts. We also considered the risk profile of investing in small and mid as opposed to large and mega buyouts. Figure 8 shows the inter-quartile ranges (IQR), calculated as the difference between the 75th and 25th percentile of the CAGR distribution. The IQR for small and mid buyouts is consistently wider which implies a higher dispersion in returns and therefore a greater degree of risk. Manager selection and portfolio construction therefore remain essential tools if investors are to access the best potential returns available at the smaller end of the market.
Figure 8: SMBO and LMBO risk by vintage
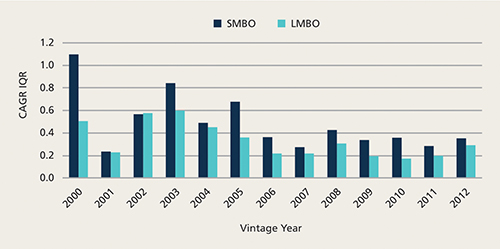
This figure plots the IQR of CAGR of SMBO and LLMBO by vintage. Deal data from Pantheon as of 2019 Q1.
3. Is a private equity manager’s track record a good indicator of future performance?
A quantitative analysis of a manager’s track record is of course a fundamental aspect of any due diligence process. In private equity this means analysing the returns of a manager’s previous funds to determine the likelihood of those returns being replicated by the new fund that is raising capital (in previous studies this concept has been referred to as the persistence of performance). This is relevant in helping to determine the extent we can rely on the track record alone, and what weight should be placed on quantitative versus qualitative factors during the due diligence of new investment opportunities.
We undertook a study comprising all buyout and venture funds in the US and Europe with vintages from 1985 to 2012 from Preqin (more recent vintages were omitted due to funds still being largely in the value creation phase). As a first step, to evaluate persistence in performance, we estimated how likely it is for a successor fund to have the same, higher or lower quartile score than the previous fund. Figure 9 presents the results of the full sample by stage. The 25% marker represents the transitional probability that a fund will be in the same quartile as its prior fund by chance and irrespective of any other factors. Therefore, the evidence presented in Figure 9 clearly supports the notion of performance persistence, i.e. there is a higher than chance probability of a successor fund being the in the same quartile as its predecessor.
Figure 9: Full sample transition probabilities
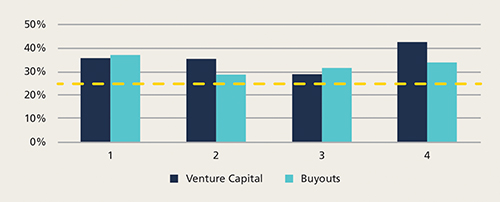
Source: Pantheon analysis of Preqin data as of December 2018. The stars above the charts indicate to what extent the estimates are statistically different from 25% according to a one-tail binomial test: *, **, and *** indicate significance at the 10%, 5%, and 1% level, respectively.
Given the significant range of vintage years in the sample (1985-2012), it is also worth seeing if persistence has declined in recent years and to do so we repeated the analysis separately for pre- and post-2000 vintages. Figures 10 and 11 summarise the results. A comparison of the two figures suggests three key take-aways. Firstly, the persistence between successive buyout and venture funds in the top quartile is largely consistent pre and post the 2000 vintage: despite a slight decline, the transition probabilities remain significantly above 25%. Second, looking at second quartile funds, transition probabilities have in fact risen post-2000 for both buyout and venture funds. Finally, the main differences in persistence between pre- and post-2000 are in the third and fourth quartiles: persistence has decreased for buyout funds, while it has increased for venture funds.
Figure 10: Pre-2000 transition probabilities
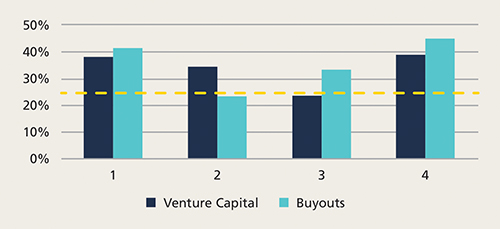
Source: Pantheon analysis of Preqin data as of December 2018. The stars above the charts indicate to what extent the estimates are statistically different from 25% according to a one-tail binomial test: *, **, and *** indicate significance at the 10%, 5%, and 1% level, respectively.
Figure 11: Post-2000 transition probabilities
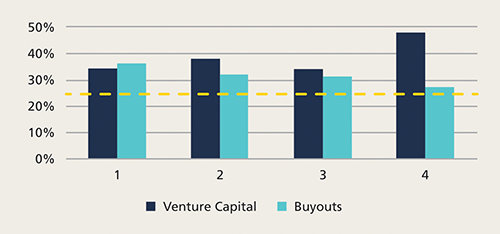
Source: Pantheon analysis of Preqin data as of December 2018. The stars above the charts indicate to what extent the estimates are statistically different from 25% according to a one-tail binomial test: *, **, and *** indicate significance at the 10%, 5%, and 1% level, respectively.
There are of course limitations to this analysis. Firstly, persistence may depend on where a manager is in its lifecycle. Managers can have successive top quartile funds, up until a point when such performance is no longer maintained. While the cause of the reversal in performance may vary case-by-case, it can be linked to raising excessive capital, strategy drift, ineffective succession planning, or failing to evolve with the market – for instance, by not investing in sector or operational improvement teams. This is where qualitative due diligence and a deep understanding of a manager is key to spot when the right time is to step away. Another consideration is that persistence may not always be exploited in the evaluation of new opportunities; track records of the more recent funds may not be fully crystallised, and the quartiles may reflect unrealised values which may change materially once the performance is fully locked-in. Last, but not least, it should be noted that access to managers whose performance persists may be restricted. Managers who are consistent top-quartile performers are generally extraordinarily difficult to access unless there is already a long-standing existing relationship.
Conclusion
To summarise the key findings from each piece of research, our conclusion is that a 20-25 fund-of-funds portfolio represents an optimal degree of diversification; small and mid-buyouts outperform larger buyout deals and, therefore, the best returns are likely to be available for investors with exposure to smaller companies; and evidence of performance persistence suggests that there is a better than chance probability that managers are able replicate performance from one fund to the next. There are deeper considerations though: a 20-25 fund portfolio assumes sufficient global coverage and resources to execute this strategy, fund selection is most critical in the small- and mid-market buyout space; strong performance may not be sustainable indefinitely, and, due to access constraints, the consistently top-quartile managers are not actionable opportunities for the majority of investors.
1. TVPI is a Private Equity performance measurement also called the multiple. It stands for “Total Value to Paid In” and represents the Total value (the unrealised value or NAV plus distributions) divided by the amount of capital paid in, or drawn, from investors. On a TVPI basis, performance is positive once the ratio is above 1.0x.
2. Monte Carlo simulations are used to model the probability of different outcomes in a process that cannot easily be predicted due to the intervention of random variables.
|
|
|