Pádraig Floyd discusses the growth of funds’ investment in real asset alternatives previously considered too risky or expensive, such as...

October 1, 2022
Report

|
Written By: Dan Parker |
Dan Parker of PineBridge Investments says it is time to reassess the traditional portfolio composition of 60% equities and 40% bonds, and outlines the benefits of multi-strategy hedge funds
In March 1952, Harry Markowitz published a research paper prosaically titled Portfolio Selection that went on to become the foundation of Modern Portfolio Theory (MPT) and led to Markowitz earning a Nobel Prize in economics. One of the paper’s most important results was that it provided the basic framework of 60% equities/40% bonds that became the anchoring benchmark for portfolio construction ever since. But now may be the time for investors to consider how best to apply and build on Markowitz’s insights in an increasingly dynamic environment – and multi-strategy hedge funds could have a role to play in further diversifying and enhancing absolute return potential in institutional portfolios.
New concerns about the old 60/40
MPT and the resulting 60/40 portfolio are driven by two key assumptions:
However, both of these assumptions now have problems:
Secular changes in monetary policy and the current trend in global interest rates appear to have destabilised the historical correlations between asset classes that formed one of the foundations for MPT and the 60/40 asset allocation framework. Low, and now rising, interest rates diminish the benefits of fixed income as a diversifier.
For the last year, fixed income beta has been hurting institutional investors anchored to a 60/40 portfolio. With pain on both sides of the 60/40 portfolio, it seems there really is no place to hide, highlighting the argument for improving diversification and the alpha component of that portfolio.
It’s important to note that most of the data in the charts shown in this article do not include 2022, and the recent data is likely to be even more compelling. That’s most true for absolute returns, but also for risk-adjusted returns, as well as the realised volatility on both equities and bonds. US Treasuries and fixed income broadly and the 60/40 allocation framework have all experienced significant drawdowns during 2022.³
Therefore, investors may need to think creatively about the tools used to achieve robust portfolio diversification and absolute returns.
A potential solution
Where should they be looking? In our view, low-beta hedge funds, such as multi-strategy funds with low net exposure and broad diversification across geographies, asset classes, and strategies, have the potential to deliver uncorrelated returns with a high Sharpe ratio. They can also reduce the performance drag that the current environment of rising interest rates has imposed on static fixed income allocations. Therefore, we believe such funds can be an important component of improving a diversified asset allocation.
The principle that portfolio construction requires diversification means the components need to be robustly diversified from each other, and also diversified from broader markets.
But in a world of rising interest rates, how might multi-strategy hedge funds fare? Many investors probably don’t appreciate that rising rates can be a tailwind for those with exposure to multi-strategy hedge funds. If the Fed funds rate in the US, for example, goes from zero to 3%, multi-strategy hedge funds and market-neutral portfolios should pick up from a performance perspective somewhere in the neighborhood of 200 basis points to 250 bps. As short-term interest rates rise, market-neutral portfolios receive interest payments on the cash proceeds of short positions. These proceeds generally earn the short-term interest rate less a spread.
And it should get some attention from a lot of investors who are thinking about the 40% they’ve allocated to fixed income – and whether a portion of that 40% might be better off in some sort of a liquid multi-strategy hedge fund, which potentially has the ability to generate meaningful uncorrelated returns.
For example, as Figure 1 illustrates, equity market neutral (EMN) and multi-strategy (MS) hedge funds have historically generated higher risk-adjusted returns versus a 60/40 equity/bond portfolio.
Figure 1: Equity market neutral (EMN) and multi-strategy (MS) hedge funds vs a 60/40 equity/bond portfolio
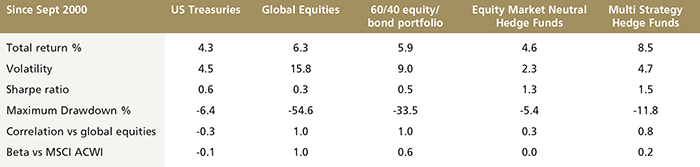
Past performance is not an indicator of future results. Source: Datastream Refinitiv and Bloomberg. Data from Sept 2000 to August 2021. Notes: based on monthly returns. U.S. equities = MSCI USA Index, U.S. Treasuries = ICE BAMLUS Treasuries Index, EMN HFs + Eurekahedge Equity Market Neutral Hedge Fund Index, MS HFs = Eurekahedge Multi-Strategy Hedge Fund Index.
Figure 2 highlights how EMN and MS strategies have historically lower portfolio volatility versus a 60/40 portfolio.
Figure 2: EMN and MS strategies have historically lower portfolio volatility versus a 60/40 portfolio

Past performance is not an indicator of future results. Source: Datastream Refinitiv and Bloomberg Data from Sept 2000 to August 2021. Notes: based on monthly returns, historical volatility and correlations. US equities = MSCI USA Index, US Treasuries = ICE BAML US Treasuries Index, EMN HFs = Eurekahedge Equity Market Neutral Hedge Fund Index, MS HFs = Eurekahedge Multi-Strategy Hedge Fund Index.
These strategies can be especially relevant for mitigating drawdowns, having provided some downside protection during major equity sell-offs.
Figure 3: Downside protection during major equity sell-offs

Past performance is not an indicator of future results. Source: Datastream Refinitiv and Bloomberg. Notes: based on monthly returns. U.S. equities = MSCI USA Index, U.S. Treasuries = ICE BAML US Treasuries Index, EMN HFs = Eurekahedge Equity Market Neutral Hedge Fund Index, MS HFs = Eurekahedge Multi-Strategy Hedge Fund Index.
Similarly, EMN and MS hedge funds have historically provided some downside protection during major bond selloffs.
Figure 4: Downside protection during major bond sell-offs

Past performance is not an indicator of future results. Source: Datastream Refinitiv and Bloomberg. Notes: based on monthly returns. U.S. equities = MSCI USA Index, U.S. Treasuries = ICE BAML US Treasuries Index, EMN HFs = Eurekahedge Equity Market Neutral Hedge Fund Index, MS HFs = Eurekahedge Multi-Strategy Hedge Fund Index.
Figures 1-4 illustrate that when it comes to portfolio construction, including multi-strategy hedge funds has the potential to improve returns while also reducing the implied volatility of institutional portfolios. And if the interest rate environment changes in a sustainable way, then it’s reasonable to think that the correlation between equities and fixed income could also be changing in a potentially significant – and sustainable – way.
This is another key reason we think multi-strategy hedge funds should be considered when evaluating the traditional asset allocation framework, especially with the correlation changes that have occurred. The message is simple: Don’t overlook the importance of what multi-strategy hedge funds can potentially deliver to total portfolio performance.
Disclosure
Investing involves risk, including possible loss of principal. The information presented herein is for illustrative purposes only and should not be considered reflective of any particular security, strategy, or investment product. It represents a general assessment of the markets at a specific time and is not a guarantee of future performance results or market movement. This material does not constitute investment, financial, legal, tax, or other advice; investment research or a product of any research department; an offer to sell, or the solicitation of an offer to purchase any security or interest in a fund; or a recommendation for any investment product or strategy. PineBridge Investments is not soliciting or recommending any action based on information in this document. Any opinions, projections, or forward-looking statements expressed herein are solely those of the author, may differ from the views or opinions expressed by other areas of PineBridge Investments, and are only for general informational purposes as of the date indicated. Views may be based on third-party data that has not been independently verified. PineBridge Investments does not approve of or endorse any republication of this material. You are solely responsible for deciding whether any investment product or strategy is appropriate for you based upon your investment goals, financial situation and tolerance for risk.
1. Source: Bloomberg. Correlations between the S&P 500 Index and the Bloomberg U.S. Aggregated Index, calculated from weekly total return date for the period 30 March 1990 – 19 November 2021.
2. Source: Datastream Refinitiv and Bloomberg. Data from Sept 2000 to August 2021. Notes: based on monthly returns. US equities = MSCI USA Index, US Treasuries = ICE BAMLUS Treasuries Index, EMN HFs + Eurekahedge Equity Market Neutral Hedge Fund Index, MS HFs = Eurekahedge Multi-Strategy Hedge Fund Index.
3. Source: Bloomberg data from January-June 2022.
|
|
|