Pádraig Floyd discusses the growth of funds’ investment in real asset alternatives previously considered too risky or expensive, such as...

October 1, 2022
Report

|
Written By: Richard Batty |
Invesco Perpetual Fund Manager Richard Batty explores some of the ways in which multi asset investing can exploit the rich seam of opportunities in today’s challenging financial markets
We see the investment landscape as having changed significantly in recent years, which has important implications for investment strategy. In particular we would highlight the emergence of four key themes for investors post the financial crisis.
First, bonds have been overwhelmingly favoured as an asset class in recent years. Globally, data from EPFR shows that 60% of cumulative fund flows by institutional investors since 2003 have been into bonds.1 This has reflected the broad-based “hunt for yield” as investors have sought the higher yield of corporate bonds, emerging market bonds and equities.
Second, in the aftermath of the financial crisis, economic growth has remained sluggish and inflation contained – even after the massive amounts of quantitative easing (QE). It is hard to see that easy stance of policy being removed at all quickly if, as we expect, these economic conditions remain key themes for an extended period.
Third, since QE policies were introduced by central banks around the world from 2008 onwards, financial markets have become particularly sensitive to announcements with regard to changes in monetary policy.
Fourth, these changing circumstances have been reflected in changing correlations across assets. In that respect, we have identified three broad phases in global markets since the 1990s (Figure 1).2
Figure 1. Bond/equity correlations and bond yields
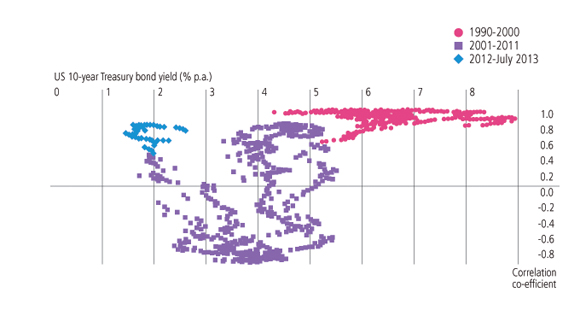
Source: Thomson Reuters Datastream. Data as at 26 July 2013.
From 1990 to 2000, the general trend was that bond and equity markets rose together. This was a period of a trend decline in inflation, interest rates and bond yields, and more stable economic growth than in the past. That environment benefited bonds and equities alike.
From 2001 to 2011, we saw “risk on/risk off” shifts. During “risk on” periods, there was a higher demand for equities, and their prices rose at the same time as bond prices tended to fall; and vice versa in “risk off” periods. So, for much of the time there was a negative correlation between the returns on equities and bonds.
Since the start of 2012, we have seen relatively high positive correlations between bonds and equities again (Figure 2). This positive correlation has been indicative of the importance of economic policy decisions for all asset markets: further QE stimulus has pushed up bonds and equities together; the threat of its withdrawal has seen both assets suffer.
Figure 2. US equity/bond correlations
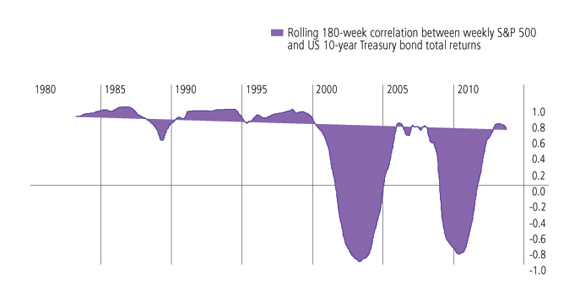
Source: Thomson Reuters Datastream. Data as at 26 July 2013.
Expanding the scope of investment
In such circumstances, we see merit in expanding the scope of investment beyond standard asset classes. Using a wider range of asset types can help in implementing ideas about the direction of economies and financial markets. Three examples illustrate this theme.
1. Currency-equity market relationships (Figure 3)
Currency markets can be useful in providing diversification. The Canadian dollar for example, has typically strengthened against the US dollar as the US equity market has rallied. This is partly because both tend to benefit from stronger global economic growth, not least because Canada tends to benefit from stronger commodity prices. Conversely, as global growth has slowed in recent months, the Canadian dollar has tended to weaken against the US dollar.
Figure 3. An example of asset diversification USD/CAD & S&P 500
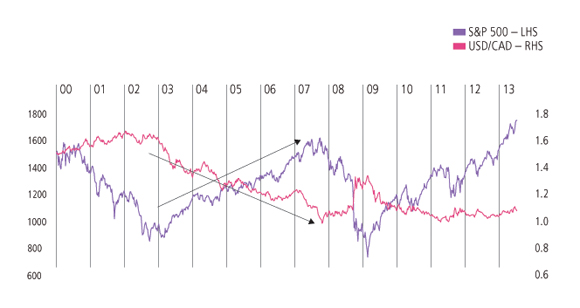
Source: Bloomberg: Data as at 28 June 2013.
2. Volatility as an alternative source of returns
Volatility itself can be seen as an alternative source of returns. In May and June 2013 when almost all financial assets fell in value, volatility increased and it was the only major source to give a positive return in that period. Volatility is particularly interesting for diversification purposes because when equity markets rise, they tend to rise steadily and volatility is low; but when they fall, they fall sharply, and volatility tends to spike higher.
3. Taking pinpointed sector exposure across markets
A view, based on an assessment of economic and financial developments of a particular sector of the economy, can be implemented by taking a relative position across markets and asset types. For example, in recent years, a view that the European bank sector would survive could be implemented by favouring investment in bank credit (which would likely benefit from measures to strengthen bank balance sheets (shown in Figure 4), whilst remaining concerned about the value of bank equity (as profitability would likely be limited since increasing capital requirements would force the scaling back of new lending). In a similar vein, a view on the relative competitiveness of different companies in an industry can be expressed by taking offsetting “long” and “short” positions.
Figure 4: Cross-asset opportunities: credit versus equity
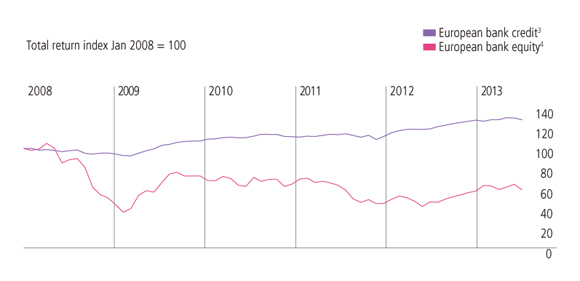
Source: Bloomberg: Data as at 28 June 2013.
Conclusions
Financial markets are dynamic and constantly changing. Monetary policy in particular is currently playing an important role in driving asset prices, and investors are lacking some important cyclical triggers for making asset allocation decisions. In this environment, sourcing investment ideas from a broader range of assets can help navigate these changing market conditions.
Important information
This article is for Professional Clients only and not for consumer use.
The value of investments and any income will fluctuate (this may partly be the result of exchange rate fluctuations) and investors may not get back the full amount invested. Where Richard Batty has expressed opinions, they are based on current market conditions and are subject to change without notice. These opinions may differ from those of other Invesco Perpetual investment professionals.
1. Source: EPFR, Goldman Sachs, data to Q1 2013.
2. The broad phases are identified by reference to the correlation patterns of the World (Equity) Total Return Index and the US 10-year Treasury bond as a proxy for global bonds. Source: Thomson Reuters Datastream and Invesco Perpetual calculations as at 15 August 2013.
3. Source: European Banks Corporate Bond index (total return), Bank of America Merrill Lynch.
4. Source: MSCI European Banks sector (total return)
|
|
|