Eric Lambert, Actuary and Independent Investment Adviser, discusses the fundamental question of the difference between strategy and implementation and shows...

April 18, 2024
Comment

|
Written By: David Crawford |
David Crawford of Nordea Asset Management follows up Nordea’s previous article on the blending of equity styles with further examination of historic data, to see how a multi-factor approach to equity investments could improve both diversification and returns
In our last article in December we discussed whether blending Low Risk equities with Quality and Value would offer higher risk-adjusted returns compared to the broader market and/or other equity styles.
We were looking at more than 16 years of data we have gathered, and our analysis led us to two main conclusions:
A. The blend of styles combining Low Risk, Quality and Value factors has generated higher risk-adjusted returns, when compared to markets and all other equity styles.¹
B. While the outperformance of a blend of styles combining Low Risk, Quality and Value factors in risk-adjusted terms has been very stable over the last 16 years, the Growth, Quality and Momentum factors have been more consistent from a pure excess return perspective.¹
As a result, it could make sense to ask if there might be any benefit in adding Low Risk, Quality and Value factors to a portfolio that has a tilt towards Growth, Momentum (or any other style for that matter), in terms of both risk-adjusted returns as well as consistency of excess returns.
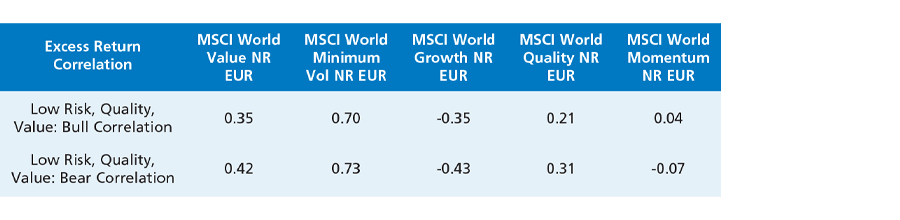
Knowing that Low Risk equities with a Quality and Value tilt might exhibit a skewed market beta (e.g. higher upside equity market capture ratio and lower downside equity market capture ratio), we believe it make sense to differentiate between the correlation in equity bull market environments and equity bear market environments.
Following that approach, Figure 1 indicates that a combination between a style blend of Low Risk, Quality and Value factors and a Growth tilted portfolio could be fruitful to investors, as their excess returns correlation during equity bull markets is negative (which implies that the Growth tilt could partially help overcome the lower upside capture ratio of low risk equities with a quality and value tilt)¹. Meanwhile, an analysis of the excess returns correlations during market sell-offs shows that – leaving aside Low Risk, Quality and Value styles – only Momentum has a near zero correlation in excess returns when markets go down, which would allow investors to preserve most of the lower downside capture ratio of a style blend of Low Risk, Quality and Value.
Figure 1: Correlation of Excess Returns vs. MSCI World Index¹
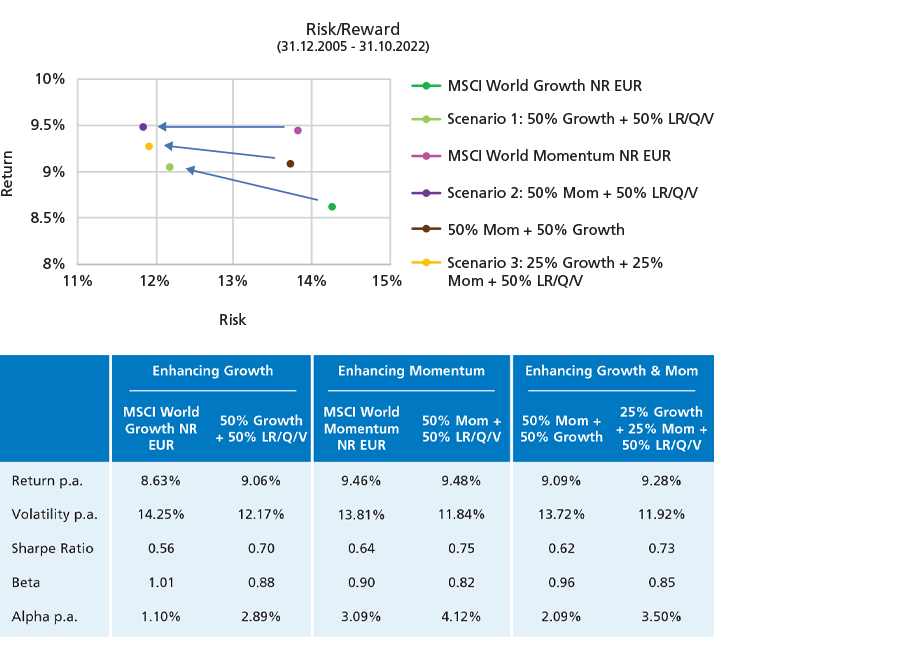
Moreover, we will now concentrate on the potential benefits of adding a style blend of Low Risk, Quality and Value to equity portfolios that have already some tilt to both Growth or Momentum factors. To shed some more light on this, we have modelled three different blended portfolios:
Scenario 1: Enhancing Growth, which shows the benefits of adding an allocation of 50% style blend of Low Risk, Quality and Value (LR/Q/V) to a Growth only portfolio
Scenario 2: Enhancing Momentum, which shows the benefits of adding an allocation of 50% style blend of Low Risk, Quality and Value to a Momentum only portfolio.
Scenario 3: Enhancing Growth & Momentum, which shows the benefits of adding an allocation of 50% style blend of Low Risk, Quality and Value to a blend portfolio that combines Growth and Momentum.
As can be seen in Figure 2, adding a style blend of Low Risk, Quality and Value to portfolios that have a clear Growth and/or Momentum bias increases performance, reduces risk (volatility and beta), hence improves risk-adjusted returns (Shape Ratio and Alpha).²
Figure 2: Enhancing Growth and Momentum´s Risk/Reward profiles²
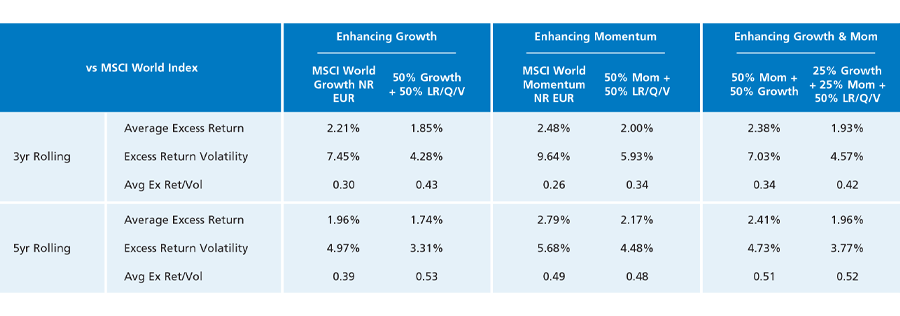
Moreover, in terms of improvements in pure performance consistency across the investment cycle, Figure 3 shows that adding a style blend of Low Risk, Quality and Value to Growth and/or Momentum tilted portfolios reduces the volatility of the three- and five-year rolling excess returns, without a large impact on the size of those returns. This translates into higher average excess returns adjusted by their volatilities.
Figure 3: Enhancing the Consistency of Excess Returns vs MSCI World³
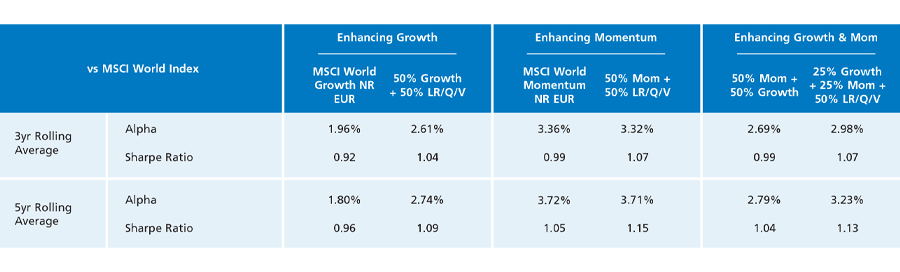
Lastly, Figure 4 also shows that consistency in risk-adjusted terms remains almost the same (in terms of Alpha of a Momentum only portfolio) but improves in any other metrics for all portfolios.
Figure 4: Enhancing the Consistency of Risk/Adjusted Outperformance vs MSCI World Index⁴
All in all, our findings seem to confirm that a multi-factor approach to equity investments improves diversification and long-term returns over the full investment cycle. Hence, adding a blend of Low Risk, Quality and Value to a portfolio that is tilted towards Growth and/or Momentum could be in the best interest of investors.
Nordea Asset Management is the functional name of the asset management business conducted by the legal entities Nordea Investment Funds S.A. and Nordea Investment Management AB (“the Legal Entities”) and their branches and subsidiaries. This document is advertising material and is intended to provide the reader with information on Nordea’s specific capabilities. This document (or any views or opinions expressed in this document) does not amount to an investment advice nor does it constitute a recommendation to invest in any financial product, investment structure or instrument, to enter into or unwind any transaction or to participate in any particular trading strategy. This document is not an offer to buy or sell, or a solicitation of an offer to buy or sell any security or instruments or to participate to any such trading strategy. Any such offering may be made only by an Offering Memorandum, or any similar contractual arrangement. Published and created by the Legal Entities adherent to Nordea Asset Management. This document is furnished on a confidential basis and may not be reproduced or circulated without prior permission and must not be passed to private investors. This document contains information only intended for professional investors and eligible investors and is not intended for general publication. © The Legal Entities adherent to Nordea Asset Management and any of the Legal Entities’ branches and/or subsidiaries.
1, 2, 3, 4. Sources: Nordea Investment Management AB and Datastream. Performance figures refer to Global Stable Equity Strategy (gross of fees) in EUR. MSCI World refers to MSCI World Index. Date: 31.12.2005 – 31.10.2022. The performance represented is historical; past performance is not a reliable indicator of future results and investors may not recover the full amount invested. The value of your investment can go up and down, and you could lose some or all of your invested money. Comparison with other financial products or benchmarks is only meant for indicative purposes.