Pádraig Floyd discusses the growth of funds’ investment in real asset alternatives previously considered too risky or expensive, such as...

October 1, 2022
Report

|
Written By: Thomas Maloney |
Thomas Maloney of AQR Capital Management makes the case for diversifying out of equities and considers the role of liquid alternatives
The last 10 years were exceptional for traditional stock/bond portfolios, and as a result pension schemes holding such portfolios have seen funding levels much improved. But with stock markets near all-time highs and bond yields near all-time lows, prospective returns look bleak.
Many investors are looking to tilt away from equity risk. We believe this should be viewed as a strategic rather than merely a tactical goal. Market timing is difficult, and expensive markets can keep rising, but better diversification is a worthy strategic aim, and if equity markets are riding high, so much the better.
This begs the question, diversify into what? Many “alternatives” share the same underlying tail risks related to the state of the global economy, including private equity, real estate, credit, and anything with implicit exposure to equity and credit risks. The next market drawdown may not be as fleeting as the crash of March 2020, and the recovery may not be so rapid. Liquid alternatives can be powerful diversifiers in unfavourable market environments, and may be a valuable addition to the investor’s diversification toolkit.
Living on borrowed time (and returns)
A simple yield-based measure of expected real return for a stock/bond portfolio (Figure 1) averaged 5% in the 1900s, fell to around 2% over the last 30 years, and dived even further in 2020-21 as bond yields reached new record lows and equity markets regained record highs. Yield declines generated high realised returns but this cannot go on forever. In effect, returns have been borrowed from the future, and eventually low expected returns will materialise for stock/bond investors, whether in a “slow pain” or “fast pain” scenario.
Figure 1: Simple expected real return of U.S. and global 60/40 stock/bond portfolios (January 1, 1900 – June 30, 2021)
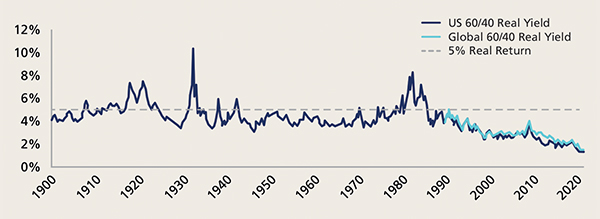
Source: AQR, Bloomberg, Robert Shiller Data Library, Ibbotson Associates (Morningstar), Kozicki-Tinsley (2006), Federal Reserve Bank of Philadelphia, Blue Chip Economic Indicators, Consensus Economics. U.S. 60/40 portfolio is 60% U.S. equities, 40% long-dated Treasuries. Global 60/40 is 60% cap-weighted developed equities and 40% GDP-weighted 10-year government bonds. Real equity yield is simple average of two measures: (0.5 * Shiller E/P * 1.075) + 1.5% and Dividend/Price + 1.5%. 1.5% term is assumed long term real earnings per share growth. 0.5 multiplier reflects long-term payout ratio; 1.075 multiplier accounts for EPS growth during 10-year earnings window. Universe of stocks is S&P 500. Real bond yield is yield minus long-term expected inflation.
Do not expect a rerun of the 2010s in the 2020s
The 2010s were characterised by positive growth and low, stable inflation. Not only did equities and bonds both deliver unusually high excess returns, they were also unusually good diversifiers to each other. This gifted exceptional performance to traditional portfolios, with some “diversifiers” lagging far behind. But now is not the time to abandon diversification.
Pandemic-related stimulus has been much larger than stimulus after the financial crisis, and the financial system is in a very different state. The medium-term inflation outlook is unclear: a wide range of outcomes seem possible, and the chances of another decade of low, stable inflation have fallen. Rising inflation would present a headwind for both equities and bonds (first three bars in Figure 2), and may also reduce the diversification benefits between them.
Elevated inflation risk provides additional motivation for diversification. Inflation-linked bonds have the ability to hedge inflation-linked liabilities but negative real yields make them difficult to hold. Real estate is another popular option, but historical analysis shows that while it may offer a little more resilience than equities or bonds, it too has tended to underperform when inflation rises (in Figure 2 we show US data but patterns are similar elsewhere). Among long-only assets, only commodities like rising inflation. Most portfolios have a downside inflation bias, which helped in the 2010s but may prove to be an Achilles heel.
Figure 2: Historical sensitivities of major asset classes to US inflation
(January 1, 1972 – June 30, 2021)
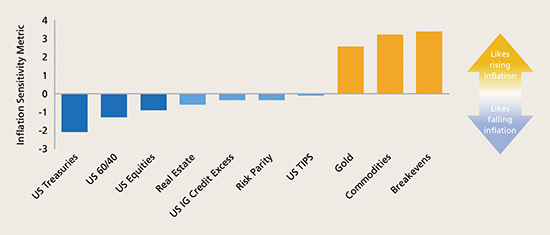
Source: AQR, Bloomberg, Survey of Professional Forecasters, U.S. Bureau of Labor Statistics. Inflation sensitivity metric is contemporaneous risk-adjusted beta to inflation changes and surprises, controlling for growth exposure. U.S. equities is represented by MSCI USA, U.S. Treasuries by 10-year Treasuries, real estate by a simple average of FSTE Nareit All REITS and NCREIF Property indices, credit by Bloomberg Barclays U.S. IG Credit Excess Return Index, risk parity by a hypothetical strategy that takes a risk-balanced allocation across equities, bonds and commodities, TIPS by 10-year U.S. TIPS, gold and commodities by GSCI indices, and breakevens by a hypothetical strategy that is long 10-year U.S. TIPS, short 10-year U.S. Treasuries. U.S. 60/40 is 60% equities, 40% Treasuries. Before March 1997, TIPS and breakevens are based on synthetic real yield series built by subtracting survey-based inflation expectations from nominal Treasury yields.
How much equity risk do you have?
A typical return-seeking portfolio tends to be dominated by equity risk. In Figure 3, we take a sample asset allocation and translate it into risk exposures. Since equities tend to be more volatile than bonds and other asset classes, a 55% capital allocation to equities accounts for 87% of the risk in the portfolio. Notably, private equity only adds to the already dominant risk in the portfolio.
Figure 3: Even apparently diversified portfolios may be dominated by equity risk
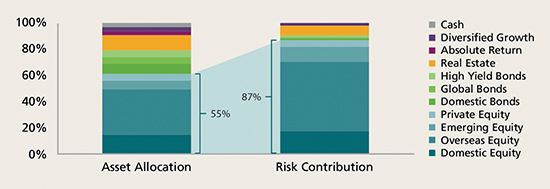
Source: AQR. Capital allocation of typical risk-seeking portfolio. Risk contribution based on volatilities and correlations of proxy indices. Equities are represented by MSCI indices, private equity by a simple average of Cambridge U.S. Buyout index and 1.2 x Russell 2000; bonds by Bloomberg Barclays U.S. Aggregate, Global Aggregate and U.S. High Yield indices, real estate by a simple average of FSTE Nareit All REITS and NCREIF Property indices, absolute return by a simple hypothetical multi-asset multi-style portfolio, diversified growth by a simple hypothetical risk parity strategy and cash by 3-month T-Bills.
The equity market crash of March 2020 was very short-lived thanks to central bank action, but not all bear markets are limited to a 20% drop, and not all are short-lived. There were three drawdowns exceeding 40% in the last half century, and worse in the half century before that.
What can investors do?
One response to low expected returns is to take even more equity risk. This may be justifiable for investors with high return objectives, constraints on leverage and exceptionally high tolerance for losses, but they should be wary of high valuations and inflation risks.
Another option is to employ option-based tail protection strategies to help insure against a large fall in equity markets. But such strategies tend to be costly to hold for long periods, and while they offer good protection against short, sharp crashes, they are not guaranteed to help in the case of sustained losses.
Perhaps the most popular response is to raise allocations to illiquid private assets. Many investors believe these offer attractive returns due to alpha potential and illiquidity premia, as well as a degree of diversification. Our analysis (see Demystifying Illiquid Assets: Expected Returns for Private Equity by Ilmanen, Chandra and McQuinn, 2020) suggests all three of these benefits may be overstated.
While private assets may help to smooth short-term fluctuations in portfolio performance by avoiding mark-to-market losses, private equity is still equity, and private credit is still credit. They do not provide exposure to fundamentally different risks like, say, the rates risk in investment grade bonds. Private assets often have large economic exposures that tend to materialise in prolonged bear markets (slow beta). And their ability to smooth returns makes them popular, probably offsetting any illiquidity premium.
That said, private assets surely deserve a place in many long-term investors’ portfolios. They provide embedded leverage, and may allow investors to maintain higher exposure to equity and credit premia than would be possible in volatile public markets. But as diversifiers they leave a gap to be filled.
The role of liquid alternatives
Liquid alternatives are active strategies designed to deliver long-term returns without passive market exposure. They seek exposure to well-documented premia such as value, momentum and quality, often across several asset classes, using financial tools such as leverage, shorting and derivatives to target and manage risk. Examples include multi-asset style premia strategies, managed futures, long/short equity and corporate arbitrage strategies.
While some liquid alternatives have performed strongly, others have disappointed investors in recent years. Equity value strategies suffered from 2018 to 2020 as growth stocks outperformed, and managed futures underwhelmed in the 2010s (after delivering strong returns during the financial crisis) as central banks curtailed market trends.
But the case for such strategies is based on many decades of empirical evidence, and economic intuition that remains valid. And because they take both long and short positions, liquid alternatives can both hedge macroeconomic exposures (like inflation risk), and mitigate the pervasive impact of low yields on expected returns. Indeed, some strategies, such as the value premium, are looking positively attractive in late 2021 (see chart A in Figure 4). Others, such as managed futures or trend following, may thrive if the next decade sees greater macroeconomic turmoil than the last (chart B in Figure 4).
Figure 4: Liquid alternatives offer bright spots in a gloomy market landscape
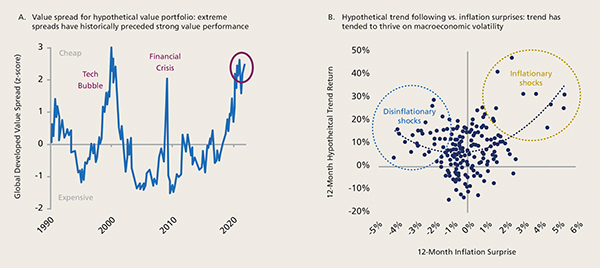
Source: AQR. Chart A: Period January 1990 to August 2021. Hypothetical value composite includes four value measures: book-to-price, earnings-to-price, forecast earnings-to-price, and sales-to-enterprise value; spreads are measured based on ratios. Spreads are constructed to be industry-neutral by comparing the value measures within each industry, then aggregating to represent an entire portfolio. Chart B: Hypothetical trend following strategy as described in A Century of Evidence on Trend Following (Hurst, Ooi and Pedersen, 2017), net of transaction costs and 2 & 20 fees. Inflation surprise is realisation minus forecast from Fed Survey of Professional Forecasters. Quarterly data.
Importantly, liquid alternatives can also help investors to reach ESG objectives. They can be designed to tilt towards sustainability characteristics alongside other style factors, and to target net zero (or even negative) exposure to carbon emissions.
A diversified approach to diversifying
Some investors with a “rearview mirror” perspective took the wrong lessons from the exceptionally benign last decade. Equity and bond market valuations will make it very difficult for such strong performance to be repeated in the 2020s, reinforcing the case for diversifiers.
For investors looking to diversify, private assets have some role to play. But an allocation to liquid alternatives is also worthy of consideration, as they provide exposure to complementary and fundamentally different sources of return. Investors must balance the desire to reduce market risk against the risk of failing to meet long-term return objectives. For many potential investments, lower equity beta means lower expected return. Well-crafted liquid alternative strategies have the potential to be powerful diversifiers in less favorable market environments, while also maintaining attractive long-term expected returns.
AQR Capital Management is a global investment management firm, which may or may not apply similar investment techniques or methods of analysis as described herein. The views expressed here are those of the authors and not necessarily those of AQR. Diversification does not eliminate the risk of experiencing investment losses. This document is for information purposes and does not constitute an offer or solicitation of an offer, or any advice or recommendation, to purchase any securities or other financial instruments, and may not be construed as such.
|
|
|