Understanding junior debt
|
|
Written By: Claire Smith
Investment Director, Private Assets
Schroders
|
|
|
Claire Glennon
UK Institutional Business Development Director
Schroders
|
Claire Smith and Claire Glennon of Schroders outline the reasons why junior infrastructure debt may be in an ideal place to form part of investors’ overall portfolios
With dry powder for infrastructure equity investment at an all time high1, project sponsors have had to become more conscious of financing costs for projects in an attempt to reduce costs to bolster equity returns. With this, we have seen the junior debt segment of the market becoming used more frequently to create more efficient funding structures.
Junior infrastructure debt offers unique characteristics for investors compared to other asset classes:
1. Risk/return profile
Junior debt offers a unique profile where investors can capture a high complexity – or illiquidity – premium for often a better credit profile compared to other asset classes or similar ratings or returns. In addition, traditional corporate bonds are highly exposed to the risk of mark-to-market price declines if a bond suffers a deterioration in credit quality and is downgraded. Infrastructure debt prices are not exposed to this risk unless there is an impairment, which is rare.
2. Portfolio benefits
The current junior debt opportunity allows investors to capture a market opportunity created by regulatory intervention.
3. Diversification
Infrastructure assets are not correlated to the general market and therefore offers diversification benefits not available through other more traditional asset classes.
With an increasingly competitive infrastructure equity market, project sponsors have had to become more sophisticated in their financing structures to try to reduce debt servicing costs. This has led to more tranching to exploit investors under different regulatory regimes and with different risk/return objectives. Solvency II and Basel III have pushed insurance companies and banks (respectively) into the investment grade segment of the market, leaving the junior debt part – which is often not investment grade – relatively uncrowded. Due to the increase in supply of junior debt and less investor demand, we believe the junior debt segment of the market may currently offer an attractive risk/return profile.
Junior debt characteristics
Junior debt is a “pure” debt play that focuses on investments in the following assets:
- Senior leveraged loans to infrastructure companies involved in expanding or “turnaround” business models.
- Tranches of debt located higher in the capital structure than traditional investment grade infrastructure senior debt strategies (subordinated and/or HoldCo debt).
Comparison of senior and junior debt
The junior debt part of the market is one which displays quite different characteristics to the senior part of the market in terms of size, opportunity, market participants, prepayment protection and risk profile. Indeed, Solvency II gives a capital reduction for investment grade “qualifying infrastructure” and one of the criteria for this is it must be senior debt, which excludes the junior debt part of the market. This creates incentives for insurance companies to invest only in investment grade debt and avoid the non-investment grade debt market. Similarly banks tend to shy away from non-investment grade investments due to the penal regulatory capital treatment.
Notably the tenor for senior and junior debt are also generally quite different: senior debt is often longer in tenor and better suited to investors looking for duration, while the junior debt part of the market tends to be shorter in term and more suited to investors who want to capture an illiquidity premium, however over a shorter timeframe.
As a result, infrastructure project sponsors have recognised this and started structuring senior and junior tranches of debt to appeal to different investor bases, which results in markedly different features, as outlined in Figure 1.
Figure 1: Senior and junior debt compared
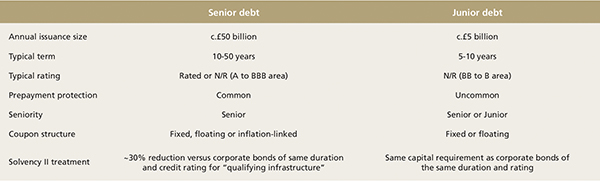
Source: Schroders, as at March 2018
When thinking about portfolio construction, senior and junior debt clearly play quite a different role in pension funds’ portfolios. Junior debt front loads returns and can assist a pension fund move to buy-out more quickly, whereas longer dated investment grade infrastructure debt can provide duration and hedging characteristics.
Risk/return comparison
Return expectations
Due to preferential capital treatment for investment grade debt, the BB segment of the market enjoys a significant spread premium for only a marginal increase in risk compared to BBB infrastructure debt.
Figure 2 shows the expected spread for infrastructure debt versus corporates across IG and high yield HY, net of expected losses. We can see HY infrastructure enjoys twice the illiquidity premium as IG infrastructure debt. This is likely due to demand in this market being more limited than in the traditional senior infrastructure debt universe due to Basel III regulated and Solvency II regulated institutions receiving preferential capital treatment for IG infrastructure debt and more generally there being fewer players in this space due to the relatively niche and newer aspect of the market.
Figure 2: Expected spread for infrastructure debt versus corporates across investment grade (IG) and high yield (HY), net of expected losses
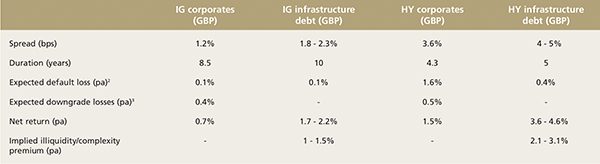
Source: Schroders March 2018, Thompson Reuters Datastream, BAML, JP Morgan, Moody’s: “Infrastructure Default and Recovery Rates, 1983–2015”. Corporate bonds spreads as at 28 February 2018.
1. Expected default loss equal to average historical default loss rate. 2. Downgrade losses assumed to be zero for private market infrastructure debt.
We can also compare infrastructure debt to other private market asset classes to see the difference in expected return and credit loss. Spread is represented by the bars on the primary axis and credit loss is expressed as a per annum figure by the dots along the secondary axis. We can see BB infrastructure debt offers a unique combination of higher expected returns coupled with a low credit risk.
Figure 3: Expected return and credit loss differences between infrastructure debt and other private assets
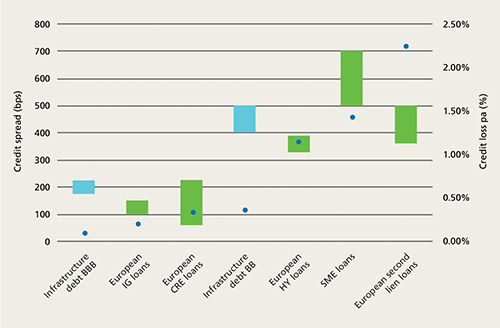
Source: Schroders, as at March 2018. Thompson Reuters Datastream, BAML, JP Morgan. S&P Global Ratings “European Loan & CLO market: Market Trends 2017 and S&P Global Ratings Outlook 2018”. S&P: U.S. Leveraged Loan Investors Continue To Find Comfort As Credit Quality Holds, At Least For The Moment, July 2017, Moody’s: “Infrastructure Default and Recovery Rates, 1983–2015”, SG “in the mood for loans”, November 2016, Moody’s: “Second-lien debt issuance slows, reflecting investors’ jitters; recoveries, already low, could get worse as credit cycle turns”, May 2016, S&P Global Ratings “European Loan & CLO market: Market Trends 2017 and S&P Global Ratings Outlook 2018”, Netspar “Credit Risk for SME loans in the Netherlands”, Moody’s Risk Calc 4.0 Netherlands.
Probability of default
Moody’s has conducted analysis of the Moody’s-rated infrastructure and project finance universe over the period of 1983–2015. They also compare this to non-financial corporate (NFC) issuers across defaults, recovery rates and migration data.
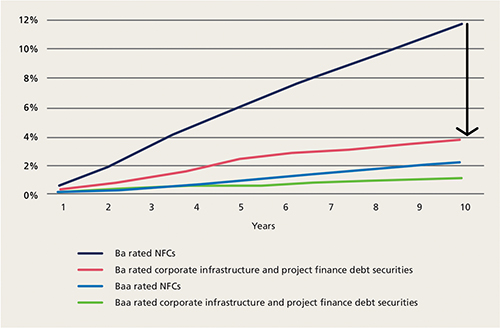
The probability of default on a cumulative basis from years since project inception can be seen in Figure 4. As this shows, Ba rated infrastructure debt is over 50% less likely to default compared to Ba NFCs over a 10 year period (8% versus 18%).
Figure 4: Default probabilities on a cumulative basis from years since project inception
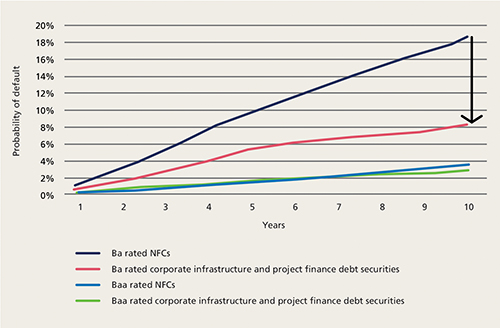
Source: Moody’s: “Infrastructure Default and Recovery Rates, 1983–2015”.
Credit loss
Ba rated infrastructure debt has a much higher recovery rate versus NFCs of the same rating: 54% for Ba infrastructure versus only 38% for Ba NFCs, as seen in Figure 5. The lower probability of default and higher recovery rate means the expected loss on Ba rated infrastructure debt is only 38% of that for Ba rated NFCs.
Figure 5: 10 year cumulative credit loss rates
Source: Moody’s: “Infrastructure Default and Recovery Rates, 1983–2015”.
Ratings migration
As displayed in Figure 6, Ba infrastructure securities are far less likely to experience a downgrade versus Ba NFCs. This is due to the essential nature of infrastructure and the fact that the purpose or strategy of an infrastructure project can’t change over time, unlike corporates which can change their product and strategy.
Figure 6: Lower likelihood of credit quality deterioration
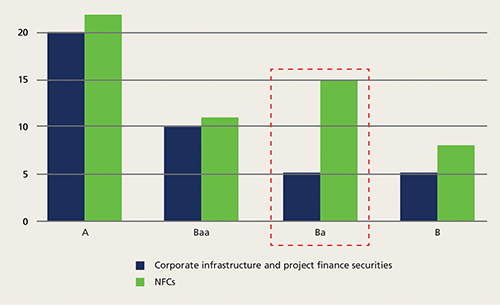
Source: Moody’s: “Infrastructure Default and Recovery Rates, 1983–2015”.
Conclusion
Junior infrastructure debt offers unique characteristics for investors compared to other asset classes due to its high illiquidity (or complexity) premium, it’s stable nature and low-risk credit profile. Differing regulatory treatment for investment grade versus non-investment grade debt has created a major divergence in investor appeal and resulting structural differences in the nature of the debt. We think the junior infrastructure debt market is uniquely placed to form part of investors’ overall portfolios due to its high illiquidity premium, lower risk credit profile and unique diversification characteristics.
Infrastructure debt key risks
Interest rate risk for fixed-rate instruments: interest rate volatility may reduce the performance of fixed-rate instruments. A rise in interest rates generally causes prices of fixed-rate instruments to fall
Deterioration of the credit quality of the bond: caused by a change in the market environment (for commercial activities) or a change in law/regulation (for all infrastructure activities)
Risk of issuer default: a decline in the financial health of an issuer can cause the value of its bonds to fall or become worthless
Prepayment risk: the capital may be repaid by the borrower before reaching maturity
Exchange rate risk: where assets are denominated in a currency different to that of the investor, changes in exchange rates may affect the value of the investments
Illiquid and long term investment risk: due to the illiquid nature of the underlying investments, an investor may not be able to realise the invested capital before the end of the contractual arrangement (which is likely to be long term). If the investment vehicle is required to liquidate parts of its portfolio for any reason, including in response to changes in economic conditions, the investment vehicle may not be able to sell any portion of its portfolio on favourable terms – or at all
Capital loss: the capital is not guaranteed and investors may suffer substantial or total losses of capital
Greenfield risks: in contrast to “brownfield” investments, investments in ”greenfield” infrastructure assets expose investors to additional risks, in particular construction risk (e.g. construction delays, cost overruns, etc.) and deployment risk (e.g. capital being deployed in several instalments during construction period rather than upfront for brownfield investments)
Operational risks
Trade cancellation risk: trades and settlements are made on a bilateral, negotiated basis. A last-minute trade cancellation can occur in the absence of standard trade and settlement processes via clearing houses
Service provider risk: investments can be at risk due to operational and administrative errors, or the bankruptcy of service providers.
Marketing material for professional investors and advisers only. Not suitable for retail clients.
The views and opinions contained herein are those of the Infrastructure Finance team, and may not necessarily represent views expressed or reflected in other Schroders communications, strategies or funds. The data contained in this document has been sourced by Schroders and should be independently verified before further publication or use. Past performance is not a guide to future performance and may not be repeated. The value of investments and the income from them may go down as well as up and investors may not get back the amounts originally invested. The material is not intended as an offer or solicitation for the purchase or sale of any financial instrument. The material is not intended to provide, and should not be relied on for, accounting, legal or tax advice, or investment recommendations. Information herein is believed to be reliable but Schroder Investment Management Limited does not warrant its completeness or accuracy. No responsibility can be accepted for error of fact or opinion. Reliance should not be placed on the views and information in the document when taking individual investment and/or strategic decisions. The forecasts included in this document should not be relied upon, are not guaranteed and are provided only as at the date of issue. Our forecasts are based on our own assumptions which may change. We accept no responsibility for any errors of fact or opinion and assume no obligation to provide you with any changes to our assumptions or forecasts. Forecasts and assumptions may be affected by external economic or other factors. Issued by Schroder Investment Management Limited (SIM), 31 Gresham Street, London EC2V 7QA. Registration No. 1893220 England. Authorized and regulated in the UK by the Financial Conduct Authority (FCA). SIM has notified the FCA as its home state regulator that it intends to conduct activities on a cross-border basis from its branch in France. SIM has a branch passport for France and services passports under the Markets in Financial Instruments Directive (MiFID) in various EEA countries. Please see the FCA register for further details.
1. Preqin, Probitas Partners, infrastructure Institutional Investor Trends for 2017 Survey – closed end funds, global. ”Dry powder” being defined as capital raised by funds but not invested.