Pádraig Floyd looks at how Emerging markets were faced with numerous macro economic and geopolitical challenges in 2022, Yet they...

February 25, 2023
Focus

|
Written By: Brian Lim |
Brian Lim from Pantheon surveys today’s asia markets, identifying areas and asset classes that could offer attractively-valued investment opportunities
Asia is today a mainstream investment market. In 20171, it represented 40% of the global listed equities market cap, and in the same year one in five M&A deals globally by value and almost one-quarter of global private equity assets under management were allocated to the region2. For many asset allocators the decision is not whether to invest in Asia, but how much and through which asset class(es).
Strong growth markets
Asia is where you go to access growth, and that growth manifests itself in several ways: the most visible one is GDP growth, where the average c.5% real GDP growth across Asia Pacific in the last 15 years is double that of the developed markets; and where in nominal terms the large economies of India and China are growing at or near double digit rates3. These factors blow a fair wind for investment, especially given forecasts for future growth remain strong4.
Figure 1: Annual real GDP growth rate (%)
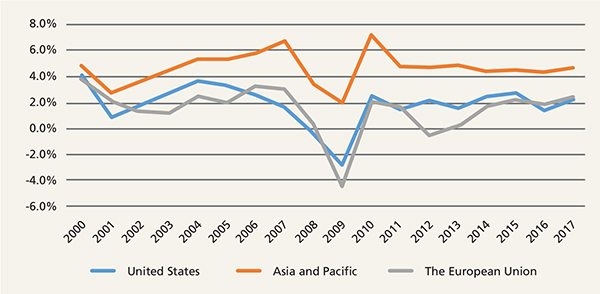
Source: World Bank, data as at January 2019, GDP (constant 2010 US$)
Figure 2: Asia real GDP growth forecast (2017-2023F)
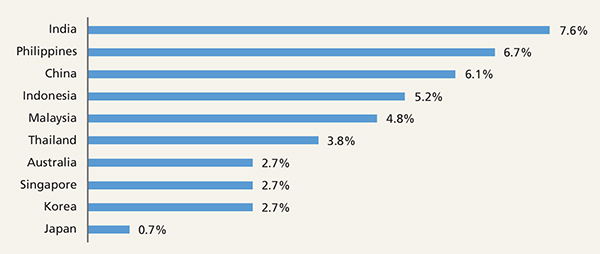
Source: World Economic Outlook (Oct 2018), GDP, national currency, constant prices. There is no guarantee the forecasts highlighted will materialise.
Much has been written about the slowdown in China’s growth, and the recent US/China trade spat has added fuel to the fire. Chinese GDP growth is indeed slowing, weighed by sluggish exports and an industrial sector burdened with decades of over-investment and over-capacity. Some slowdown in growth is reasonable to expect given how much bigger China’s economy is today relative to when it was growing at double digit rates; China is the second biggest economy in the world today, has grown over two and half times since 2008 and outgrew output by the equivalent of the Australian economy in 2018 alone.
Figure 3: China economic growth
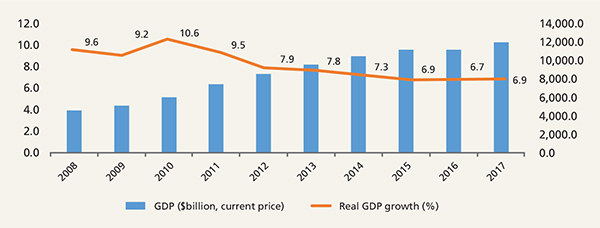
Source: World Economic Outlook (Oct 2018).
The good news is that consumption, underpinned by a large and young middle class with increasing disposable income, is a growing contributor to growth. Today the Chinese service sector accounts for more than half of China’s GDP and is an important creator of new jobs. As an example, while the transformational impact of Chinese tourists in overseas markets has been widely commented upon, less acknowledged is its domestic growth which has been similarly significant – up 10% with 5.5 billion homeland trips last year.
Figure 4: China’s private consumption as % of GDP
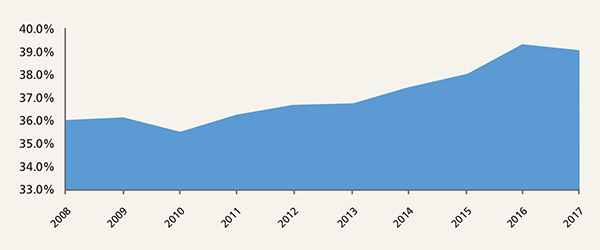
Source: CEIC Data
Asia is enjoying a demographic dividend. India and China are home to 2.5 billion citizens between them. Their large, young and growing labour force has the will and the means to consume a vast array of products and, increasingly, services. It is not just the volume of consumption that is increasing, its pattern is also changing, catalysed by technology and digitisation and disrupting many traditional sectors from retail, restaurants, banking, to transportation and logistics.
Figure 5: Top 20 technology companies and unicorns
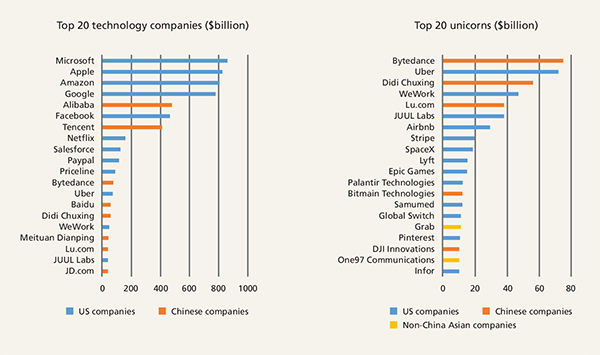
Source: CB Insights, Capital IQ, market cap as of February 27, 2019. Private companies based on latest round of valuation.
Transformational impact of technology
Many Asian businesses are leading the way globally in their sectors: companies such as Meituan are transforming consumption through its hybrid service model of the equivalent combination of Yelp for restaurant reviews, OpenTable for seat bookings, Groupon for package deals and Deliveroo for food deliveries. Bingobox, an un-manned checkout-free convenience store chain, leverages China’s lead in mobile payments (where transaction volumes in 2017 were over 150x higher than the US)3. Facial recognition technology is currently widely used in the financial industry for fraud detection in a country with a limited credit scoring system (an example being Experian); and to facilitate transactions and companies such as Alipay, Alibaba’s payment arm, use Face++’s “smile-to pay” technology for mobile transactions5.
With a large consumer base and the increasing adoption of the latest technology across consumers and businesses, it is perhaps not surprising to see a number of Asian companies feature prominently in current league tables of the largest technology and most valuable venture-capital backed companies.
Figure 6: MSCI country weights for AWCI Index and AC Asia Pacific Index
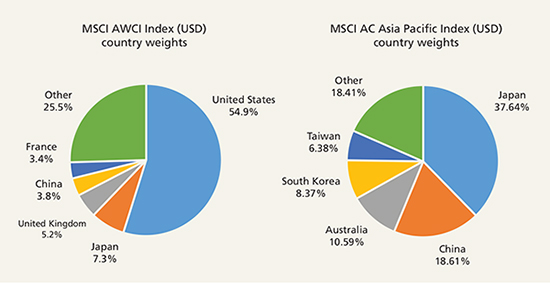
Source (left chart): MSCI; the MSCI ACWI captures large and mid-cap representation across 23 Developed Markets (DM) and 24 Emerging Markets (EM) countries. With 2,757 constituents, the index covers approximately 85% of the global investable equity opportunity set. As at February 2019.
Source (right chart): MSCI; the MSCI AC Asia Pacific Index captures large and mid-cap representation across 5 Developed Markets countries and 9 Emerging Markets countries in the Asia Pacific region. With 1,343 constituents, the index covers approximately 85% of the free float-adjusted market capitalization in each country. As at February 2019.
Listed equity vs private equity
For reasons that include size, trading volume, free float, and various currency and other regulatory restrictions for foreign investors, Asian markets have a relatively low weight in global market indices (e.g. MSCI AWCI, left chart, Figure 6). For investors pursuing a broader set of opportunities in the Asian listed markets, a pan-Asian benchmark (e.g. MSCI AC Asia Pacific) would also typically underweight some of the higher growth economies, such as China and India (right chart, Figure 6).
Figure 7: Country and sector exposures of Asia listed markets
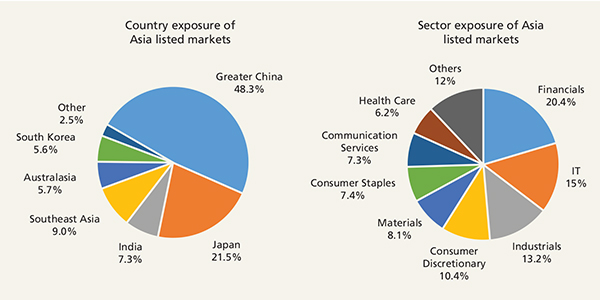
Source (left chart): Capital IQ, market capitalization as at February 18, 2019. Note: weighted by total market cap of all local stock markets)
Source (right chart): Capital IQ, market capitalization as at February 18, 2019.
A key feature of many listed markets, and the Asian ones are no exception, is that they are generally heavily weighted towards large cap companies and more mature established sectors such as financials and industrials, with more limited exposure to some high-growth sectors such as healthcare, and segments of discretionary consumption. As an example within the listed technology sector, c.60% of the market cap is in equipment and hardware listed companies, with more limited exposure to the high-growth and high-margin software and services segments.
Figure 8: Healthcare market vs GDP forecast
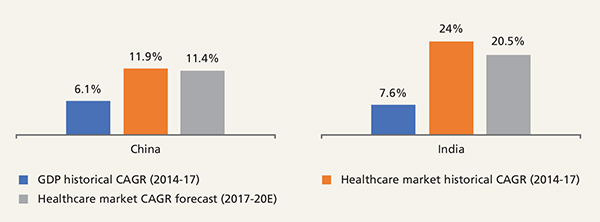
Source: Capital IQ, IMF, Euromonitor, Statistia; Healthcare market size: total healthcare expenditure for China; healthcare market size for India; total private sector healthcare expenditure for Australia. GDP: IMF World Economic Outlook (Oct 2018), national currency, constant prices.
Getting access to these growth opportunities can be a challenge for many investors, as there are insufficient opportunities available through the listed markets alone. The private equity market on the other hand can offer investors the means to invest in dynamic companies while at interesting inflexion points of value and growth.
Companies in the healthcare sector are a case in point: themes such as changing diets and an ageing population in some parts of Asia are driving niche, but fast-growing investment opportunities. Moreover, the rapid increase in the market share of innovative drugs in China, supported by research and development and a favourable regulatory environment, together with the expansion of branded providers across a multitude of healthcare subsectors in India and Australia, are investment themes that are currently featuring prominently in many private equity portfolios.
Figure 9: Asia public markets valuations
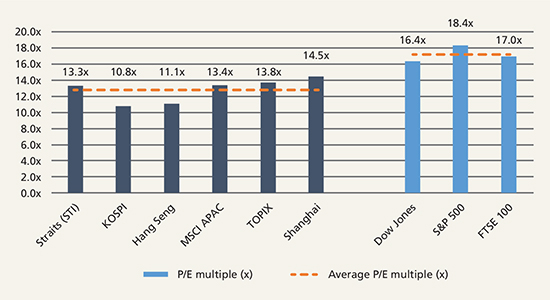
Source: Bloomberg, as at March 5, 2019.
Attractive growth and value characteristics
One of the attractive traits of the Asia market today is the mix of growth and value. The growth opportunities described are clear and today, Asian valuations are trading at significant discounts to their Western counterparts, and at or below their long-term averages.
Figure 10: Price/Earnings ratio of S&P 500 vs MSCI Asia
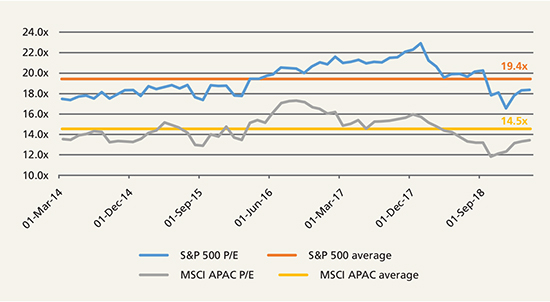
Source: Bloomberg from March 2013 to March 2019; P/E ratios based on Last Twelve Months’ earnings.
Conclusion
In our view, countries such as China, India and Australia demonstrate an optimal mix of scale, consumption power and attractive demographics. Private equity can provide investors with opportunities to build exposure to some of the companies that may benefit the most from the growth and value characteristics that Asia offers today. Private equity’s model of investing over the long term, with discipline and in close partnership with management teams, is also well aligned to the dynamic entrepreneurs in the region.
We believe that Asia currently offers a rich seam of investment opportunities at attractive valuations. Success criteria include, in our view, careful selection, an on-the-ground presence, local knowledge and experience built up through several market cycles. The good news is that there is today a deep private equity opportunity set that meets these criteria. And that is why we are excited by the Asia private markets today.
1. World Bank, data as at January 2019
2. Bain & Company, Asia Pacific Private Equity Report 2018
3. World Economic Outlook (Oct 2018), India GDP growth rate at 14.5% from 2016-17, China GDP growth rate at 7.1% from 2016-17.
4. World Economic Outlook (Oct 2018), GDP of emerging and developing Asia is estimated to grow at 8.4% CAGR from 2017-23.
5. Examples above are provided for illustration purposes only and do not present a comprehensive list of all disruptive companies, nor do they provide any guarantee of future disruption or growth. They may or may not include examples of companies in which Pantheon has made an investment.
Published: February 1, 2019
Home »
Emerging Markets