Pádraig Floyd looks at how Emerging markets were faced with numerous macro economic and geopolitical challenges in 2022, Yet they...

February 25, 2023
Focus

|
Written By: Matthew Murphy |
Matthew Murphy of Eaton Vance argues that the diversity and range of available investments in the emerging markets regions provide opportunities that should not be overlooked by investors
Given the potential offered by the asset class, local authority pension funds may well be under-exposed to the opportunities in emerging markets (EM) debt. The potential for return diversification and attractive additional yields, and an increasing range of investment options that have driven the growth of the asset class, have largely been missed. Beyond allocations within more diversified fixed income portfolios, which fail to access the full opportunity set in the asset class, few individual LGPS funds have exposure, and setting up EMD sub-funds has not been a priority for the majority of the new pools.
So how do local authority funds allocate to this complex, diverse asset class? For what typically represents a small allocation in the grand scheme of things, investment committees and their advisers face a range of decisions: which benchmark to use, whether to include both hard currency- and local currency-denominated bonds, how much to allocate to this asset class, and so on.
A common approach is to allocate top-down to one or more sub-asset classes, with the reference investment universe defined by the composition of an index or blend of indices. In our experience, investment committees will approve a mandate with a fully unconstrained benchmark only when its governance structure allows for such flexibility and only after conducting thorough due diligence on the elective investment manager.
Reasons for this general gravitational pull towards index constraints on portfolio construction (e.g., in the form of narrow tracking error limits and limited flexibility to allocate to off-benchmark issues) appear to include:
Clearly, following a well-trodden path is comfortable, convenient and reassuring. However, in Eaton Vance’s view, investment committees and trustees would generally do better to look at a truly active, benchmark unconstrained investment approach; relegating the use of indices to a relative performance reference measure. Below, we set out some of the reasons for our view.
Indices are concentrated, increasing risk. For example, the top 10 countries in the JPMorgan GBI-EM Global Diversified (“GBI EM”) account for 81% of its weight. This concentration of a relative handful of larger EM issuers has been a major source of this index’s historical volatility.
The true opportunity set is much larger than indices suggest. As shown in Figure 1, the tradeable investment opportunity set is vastly bigger than that defined by the makeup of commonly used EM debt benchmark indices.
Figure 1: Indices fail to represent the investment opportunity set
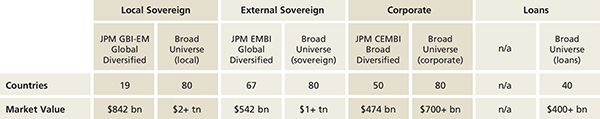
Source: Eaton Vance and JP Morgan as at 31 December 2018.
Index-constrained strategies reduce alpha potential. Strategies that rule out non-benchmark countries greatly reduce alpha potential and may also be at risk of having to hold meaningful positions in markets and securities whose fundamentals or relative valuations are deteriorating. Investment committees should bear in mind that adopting an index-constrained investment approach effectively entails turning over investment decisions to an index provider – typically an investment bank – which has its own interests at heart. In our view, index providers focus essentially on those countries in which they have business operations and cater to the largest common denominator: they want the largest investment managers to be able to replicate their index.
EM debt is a relatively incipient asset class that lends itself to active management. This asset class is still evolving, and, as such, has inherent inefficiencies that can be exploited. Our research has found, for example, that buying/selling bonds that are cheap/rich to a simple yield curve model can yield substantial risk-adjusted returns. A prime example of an inefficient yield curve can be found in Indonesian government bonds. Figure 2 plots every Indonesian bond in the GBI-EM (blue dots), along with a fitted yield curve (red line) produced using the Nelson-Siegel model: a standard model used to estimate smoothed yield curves.
We have calculated that if investors, based on data over five years to 31 December 2018, had simply bought the cheap local currency-denominated Indonesia government bonds (bonds with yields above the red line) and sold the richer valued equivalents, they would have achieved substantial risk-adjusted returns (a calculated Sharpe ratio of 1.58). The table in Figure 2 shows modelled Sharpe ratios for Indonesia as well as other countries in the GBI-EM, using the same methodology.
Figure 2: Inefficient yield curves are a persistent feature in local emerging markets
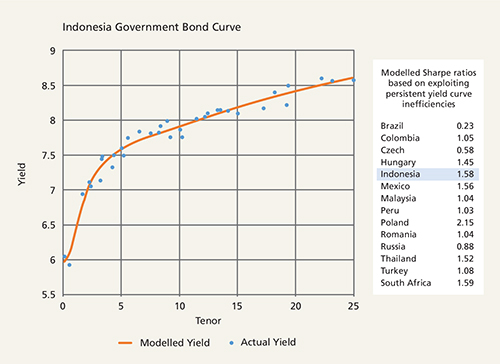
Source: Eaton Vance as at 31 December 2018. Scatter-line chart shows how much actual yields can differ from a theoretical, smoothed yield curve. This inefficiency can be exploited by buying cheap bonds (those with yields above the smoothed line) and vice-versa. This strategy can produce attractive risk-adjusted returns. The table shows the result (Sharpe ratio) of this strategy across various local currency sovereign markets. Modelled results based on Eaton Vance proprietary analysis covering five years to 31 December 2018.
The value-add of research in emerging markets is significant. There are fewer analysts covering this universe compared to say, the S&P 500 Index universe. Fundamental research, particularly at the country level, can help identify both the most attractive opportunities available and assess downside risk.
EM debt is a non-homogenous universe. Generalisations about this asset class abound and are often unhelpful. Take 2018, for example. Commentary in the media and elsewhere highlighted that this was a difficult year for EM debt. What wasn’t highlighted is that there were several off-benchmark, idiosyncratic countries that delivered double-digit gains (Figure 3). Truth is, this asset class exhibits considerable disparities across issuers at any given point in time. If one looks at EM bonds in terms of their component risk factors – currency, interest rates, sovereign credit spreads and corporate credit spreads – you will see substantial differences across countries. This disparity, in our view, points to the value of a selective, active approach to this asset class.
Figure 3: Sample of off-benchmark EM debt returns (2018 total return*)
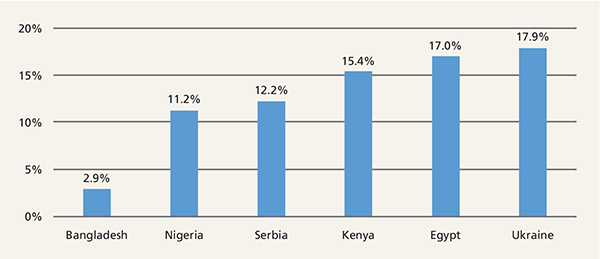
Source: Eaton Vance. *Return represents performance of a representative asset in each market. Serbia return hedged vs EUR, all others vs USD. Performance excludes taxes and fees. “Off-benchmark” here refers to countries not included in JPMorgan GBI-EM Global Diversified, commonly used as the benchmark for local currency-denominated EM bonds. Past performance is not a reliable indicator of future results. Data provided is for informational use only.
We acknowledge that many pension fund guidelines call for the inclusion of a benchmark. In cases where investors want to invest across a broad opportunity set (hard and local currency sovereigns, and corporates), using a blended benchmark of something like 50% JP Morgan GBI -EM Global Diversified, 25% JP Morgan EMBI Global Diversified and 25% JP Morgan CEMBI Broad Diversified – which reflects the market capitalisation of debt outstanding in the broader universe – could be an option.
However, we believe a benchmark should function largely as a reference for portfolio performance. Allocation strategies based principally on overweighting and underweighting common EM indices are, in our view, not optimal for investing in this sector. For now, we wish to leave readers with two key observations. One: Investing in EM debt need not be as risky as indices suggest. Two: In our view, based on our performance data, there is clear evidence that an active, benchmark unconstrained investment approach can deliver benchmark-beating risk-adjusted returns over time.
Sources: JP Morgan and Eaton Vance. Data as at 31 December 2018 unless otherwise specified. Investment views correct as at 14 March 2019.
For Professional Clients/Institutional Investors use only. This material is presented for informational and illustrative purposes only and should not be construed as investment advice, a recommendation to purchase or sell specific instruments, or to adopt any particular investment strategy. It has been prepared on the basis of publicly available information, internally developed data and other third party sources believed to be reliable.
Debt securities are subject to risks that the issuer will not meet its payment obligations. Low rated or equivalent unrated debt securities of the type in which a strategy will invest generally offer a higher return than higher rated debt securities, but are also subject to greater risks that the issuer will default. A strategy’s performance is sensitive to stock market volatility, adverse market, economic, political, regulatory, geopolitical and other conditions in emerging market countries.
Eaton Vance Management (International) Limited (“EVMI”) is not responsible for any subsequent investment advice given based on the information supplied. Past performance is not a reliable indicator of future results. This material is issued by EVMI who is authorised and regulated in the United Kingdom by the Financial Conduct Authority. Visit EVMI at https://global.eatonvance.com.
JP Morgan Government Bond Index – Emerging Market (GBI-EM) Global Diversified is an unmanaged index of local-currency bonds with maturities of more than one year issued by emerging markets governments. JP Morgan Emerging Markets Bond Index (EMBI) Global Diversified is an unmanaged index of USD-denominated bonds with maturities of more than one year issued by emerging markets governments. JP Morgan Corporate Emerging Market Bond Index (CEMBI) Broad Diversified is an unmanaged index of USD-denominated emerging market corporate bonds.
Published: February 1, 2019
Home »
Emerging Markets