Maria Municchi of M&G outlines the concepts behind building sustainability into a multi-asset strategy
Pension schemes looking to deliver retirement incomes...

June 1, 2019
Report

|
Written By: Matt Jones |

|
Andy Bush |
Pantheon’s Matt Jones and Andy Bush discuss the surging growth of the Private Equity Secondary Market and the implications for investors
A secondary allocation has long been employed by investors as a means to mitigate the J-curve, accelerate deployment of capital and add diversification to their private equity allocation. It has also offered the opportunity to gain exposure to private equity companies at a discount to their fair market value, therefore potentially enhancing returns. Furthermore, as illustrated in Figure 1, Secondaries have historically delivered better risk-adjusted returns relative to any other private equity sub-sector.
Figure 1: Secondaries have generated attractive risk adjusted returns historically
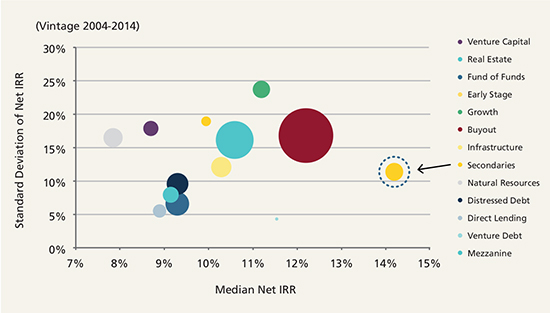
Source: Preqin Performance Analyst and “The Global Secondaries Market: Insights, Return Prospects & Deal Flow”, Preqin, September 2017. Notes: Standard deviation shown is explicitly NOT a measure of risk but shows the spread of performance across funds in the sample. Past performance is not indicative of future results. Future performance is not guaranteed and a loss of principal may occur. There’s no guarantee these trends will continue.
With these factors in mind, investor capital continues to pour into secondary funds. $90 billion has been raised by secondary funds globally in the period 2016 to 20181. This has in turn fuelled ever increasing deal activity and competitiveness for secondary buyers (those managing secondary funds and certain large institutional investors). Deal volume has increased from $25 billion in 2012 to $74 billion in 2018 (as shown in Figure 2), while headline pricing (the price at which secondary stakes are changing hands expressed as a premium, par or discount to the fair market value) has narrowed and hovered close to par in recent years (as shown in Figure 3).
Figure 2: Secondaries transaction volume
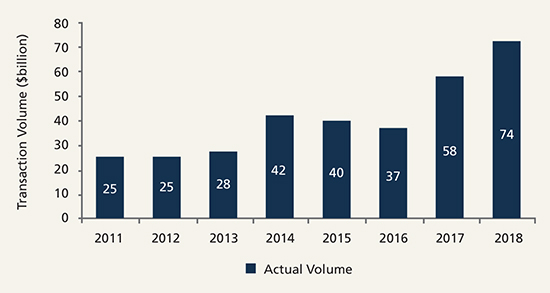
Source: Greenhill Cogent – Secondary Market Trends and Outlook, January 2019
Figure 3: Secondary pricing
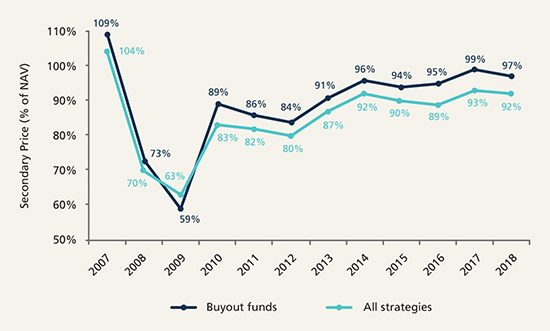
Source: Greenhill Secondary Pricing Trends and Analysis, January 2019. There is no guarantee that these trends will continue.
In this context there are certain key questions that may be posed. What is driving the vast expansion of the secondary market? Is it sustainable? Is there too much capital chasing too few deals? Is it still feasible for buyers to gain an edge and uncover value? Does a secondary allocation still make sense?
What is driving the market expansion and is it sustainable?
The secondary market is a derivative of the broader private equity market, and its growth is tied to the growth of the overall asset class. The secondary market has though expanded at a faster rate relative to private equity as a whole, evidenced by the turnover ratio (the percentage of total private equity AUM that turns over on the secondary market), which has gradually increased over time and stands at ~1.3% for 2018 (as illustrated in Figure 4).
Figure 4: Secondary market turnover is rising
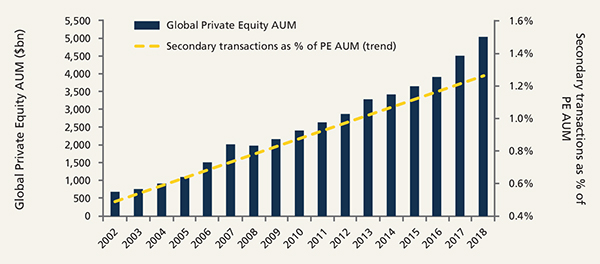
Source: Preqin private capital market data to Q4 2018 as at February 2019. PE AUM defined as unrealised value plus uncalled capital held by private equity funds at the calendar year end; Greenhill Cogent – Secondary Market Trends and Outlook, January 2019. Secondary PE Market volume: – 2002: $1.9bn, 2003: $5.0bn, 2004: $7.0bn, 2005: $6.7bn, 2006: $10.0bn, 2007: $18.0bn, 2008: $20.0bn, 2009: $10.0bn, 2010: $22.5bn, 2011: $25.0bn, 2012: $25.0bn, 2013: $27.5bn, 2014: $42.0bn, 2015: $40.0bn, 2016: $37.0bn, 2017: $58bn, 2018: $74bn.
There are perhaps two key drivers to this: (1) institutional investors, or Limited Partners (“LPs”), in private equity funds have become more pro-active in portfolio management and in re-balancing or stripping down their exposures via the secondary market, therefore selling their stakes via a “traditional” secondary sale (as explained in Figure 5); and (2) the increasing trend of General Partners (“GPs”) utilising the secondary market to generate liquidity solutions for their investors (as explained in Figure 5). In fact, GP-led deals are becoming more and more common, and are making up a larger and larger share of the total transaction volume (as shown in Figure 6). While this was a technique once employed by lower quality GPs who were perhaps struggling to raise new funds (sometimes referred to as “zombie funds”), these transactions are increasingly being initiated by top-tier brand name GPs. We believe GP-led deals are here to stay, are likely to become more and more mainstream and will fuel growth in the secondary market as a whole. This is because, as long as they are appropriately structured, these transactions can provide favourable solutions for all parties. A third contributor to growth has been the increasing prevalence of intermediaries making a market by connecting buyers and sellers.
Figure 5: Traditional LP deals and GP-led deals explained
Traditional LP deals are situations where an existing LP in a closed-ended fund initiates a process to sell that position (typically via an intermediary) to a secondary buyer who will then replace that LP in the fund. This could be a deal involving a single fund or a portfolio of various funds. A GP-led deal is a transaction initiated by the GP as a means to create liquidity for the existing LPs in a fund, typically towards the end of the fund term, transferring the ownership of those assets to a secondary buyer. A GP may undertake a transaction in a situation where the existing LPs have a desire for liquidity, but the GP also wants to maintain ownership of the assets over a longer period of time to maximise value. These transactions can involve the restructuring on an entire fund or a tender process whereby existing LPs have the option as to whether or not to sell their stakes. GPs may also initiate single company deals, where they create some liquidity for existing LPs, by transferring the ownership of one company to a secondary buyer.
Figure 6: Market share by transaction type
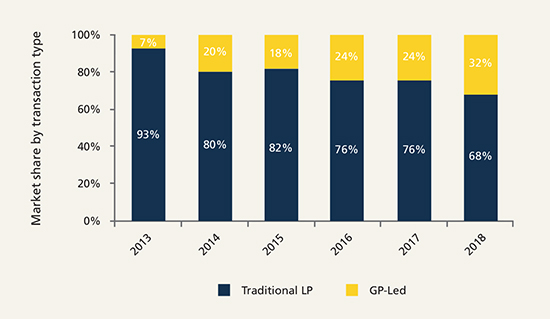
Source: Greenhill Cogent – Secondary Market Trends and Outlook, January 2019.
The market expansion has led to myriad different transaction types. Traditional LP sales still prevail in addition to a broad range of more creative transactions on the GP-led side. A market has also developed for tail end positions (which allows sellers to clear out legacy positions and has become an increasingly attractive option for fund-of-funds and institutions alike). Similarly deals now come in all shapes and sizes, from very large and diversified portfolios of multiple funds, which can amount to $1 billion plus in size, to concentrated single fund stakes or even single company deals (via GP-led situations). This has led to managers of secondary funds being able to clearly define investment strategies and specialisms and determine at the outset the types of deals that fit within that approach. Like the buyout market, there are now mega, large, mid and small sized funds, each picking their spots and seeking to exploit the opportunities in their own segment of the market. This contrasts with the environment of 10 or 15 years ago, when the market was still characterised as very opportunistic.
Is there too much capital chasing too few deals?
Record amounts continue to be raised by secondary funds. It is therefore also worth examining whether the growth of the market is keeping apace with the amount of capital being raised and “dry powder” chasing deals. One way of assessing this is looking at the capital overhang ratio, i.e. the market size (in this case measured by transaction volume over the last twelve months) as a percentage of the total dry powder (or near-term available capital). As illustrated in Figure 7, the latest capital overhang ratio is 2.6x. This implies that, assuming the market size remains constant (which is a conservative assumption given the growth rate over recent years and fundamentals in place set to drive further growth), the current “dry powder” will take 2.6 years to deploy. Given that secondary funds typically deploy capital over a three-to-four year period, this suggests that the supply and demand dynamic is in relative equilibrium. It also compares favourably when the same measure is applied to the buyout market.
Figure 7: Capital overhang
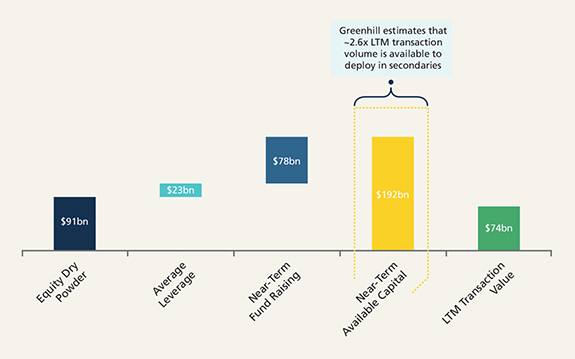
Source: Greenhill Secondary Pricing Trends and Analysis, January 2019; Evercore Private Capital Advisory YE 2018 Secondary Market, January 2019. There is no guarantee that these trends will continue.
Is it still feasible for buyers to gain an edge and uncover value?
A larger and more crowded market inevitably means that investors have to work harder to find good deals. In our view however, the secondary market will always have the potential to be somewhat inefficient. By definition, private equity companies are not publicly traded assets where a price is struck on an open-exchange. We believe preferential access to information and long-standing GP networks are fundamental to gaining an edge in the secondary market. Unlike in the public markets, it isn’t always a level playing field.
Is it all about the discount?
The price at which a secondary transaction is bought and sold is determined as the discount or premium struck against the latest NAV, or fair market value. Headline market pricing, as shown in Figure 3, where 97% for 2018 equates to a 3% discount, doesn’t suggest a particularly compelling buying opportunity. This doesn’t really paint the whole picture though. Firstly, there is a marked dispersion in the underlying data, with some deals closing well above and some well below par. It also doesn’t reflect the quality of the funds and assets being bought and sold. Paying a premium for high quality assets may make for a better investment than negotiating a deep discount for a portfolio of lower quality assets. Secondary buyers with preferential access to information on the funds and companies underlying the transaction, perhaps because they have a relationship with the GP through an existing investment in the fund(s) in question, can gain a clear advantage in underwriting a price commensurate to the quality of the assets.
Digging into the fair market value
Delving a bit deeper we should also question what the NAV or fair market value actually means. Despite a range of accounting standards and guidelines, interim private equity valuations remain more of an art than a science. GPs retain a fair amount of discretion around how they value their assets each quarter. Some are naturally conservative, holding back their company valuations during their hold period for a variety of reasons, while others are more aggressive. A secondary buyer with intimate knowledge and experience of the valuation policy of a GP can gain an advantage over a competitor who is taking the NAV at face value when determining the price they are willing to pay.
Exploiting the time lag
Another dynamic that can be exploited in the secondary market derives from the time lag between the valuation date at which bids are submitted and the date at which deals are closed, which is typically two or three quarters. Again, a buyer with intimate knowledge of the underlying assets in a transaction may have visibility on the near-term prospects of those assets, such as a valuation write-up or an imminent exit, that can lead to a meaningful upswing in the NAV in the period between the bid date and the close date, potentially turning a premium bid price into a meaningful effective discount at close.
Barriers to entry can create less competitive situations
There are further factors, or barriers to entry, that can give certain secondary buyers an advantage over others. One example is the complexity premium around GP-led deals which narrows the field of buyers. These transactions are complex by nature and can be very resource intensive. Another example involves secondary opportunities in certain high demand and top-tier GPs, typically in the mid-market, who can afford to be very restrictive in who they will allow to buy a secondary stake in their funds. Generally, such GPs will only consider existing investors in their funds with whom they already have a long-standing relationship. This can narrow the field of potential buyers, and the competitive dynamics, considerably.
In summary, we believe there are several fundamental factors that will continue to drive the expansion of the secondary market. We also think there is clear evidence that contradicts any suggestion that there is too much capital chasing too few deals. There is now a hugely diverse range of opportunities for buyers, and inherent information asymmetries mean that inefficiencies will continue to persist. This in turn provides the opportunities for secondary buyers, and investors in secondary funds, to continue to generate compelling risk-adjusted returns. In our view, all of the traditional benefits of secondaries as a portfolio construction tool (J-curve mitigation, quick capital deployment and diversification) still hold true. With these factors in mind we consider a secondary allocation remains very additive to any investor’s broader private equity programme.
1. Preqin
|
|
|