Pádraig Floyd looks at how Emerging markets were faced with numerous macro economic and geopolitical challenges in 2022, Yet they...

February 25, 2023
Report

|
Written By: Glen Finegan |
Glen Finegan of Janus Henderson Investors argues the case for active investment in emerging markets
There is an increasing trend for investors to allocate to emerging market equities using an index-based approach. We believe that this overlooks a number of key drawbacks and the potential benefits of active management. Many indices are weighted by market capitalisation, rather than conviction in a business and its long-term performance, and this distortion may expose index-based investors to increased risk within emerging markets. We believe that a selective approach is paramount to balance the long-term opportunities against a wide range of risks.
Within global emerging market equities, as in other equity classes, there has been a significant shift within the asset management industry towards passive investing and a willingness to look away from active management. The incremental flow of capital into the asset class has overwhelmingly voted against active management. Long-term investors with an absolute return mindset may be wise to question the prevailing orthodoxy.
See no evil
Emerging market equities present attractive opportunities for long-term investors, predominantly because of the positive long-term secular trend of favourable demographics. Significant projected population growth primarily in less-developed economies, rising standards of living and an emerging middle class offer fertile ground for investors to seek to capitalise on.
The MSCI Emerging Markets (EM) Index, the predominant emerging markets benchmark, by comparison, is constructed in such a way that it reflects where large pools of capital have been attracted or created. It does not necessarily reflect where future opportunities for long-term investors lie. The index is weighted by market capitalisation, which means it is influenced by the scale of a business and its equity base. Therefore, index-based investments and returns are often shaped by company size rather than the investor having conviction in a business and its performance over the long term.
The EM index has a long track record of such distortion. As shown in Figure 1, Mexico – at around 30% – was the largest country weight in 1992. This was a result of former President Carlos Salinas de Gortari’s privatisation spree of large, state-controlled enterprises which attracted capital flows from foreign investors. This meant that an investor in a passive or index-focused approach at that time would have had around a third of their money invested in Mexico. Taking an index-based approach to EM would have left investors heavily exposed to Mexico’s then weak regulation, corruption and political and economic instability. What followed was a mid-1990s financial crisis, which was fuelled further by a credit boom and a level of inflation higher than the US, Mexico’s main trading partner, thus making exports from Mexico more expensive and imports from the US cheaper.
Figure 1: MSCI Emerging Markets Index country breakdown in 1992 and 2017
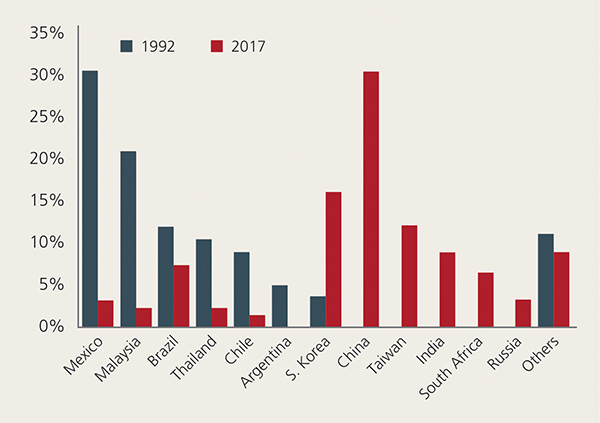
Source: MSCI as at 31 December 1992 and 31 October 2017
Where are populations growing?
The EM index is now dominated by two countries – China and South Korea – which combined make up just under half the index. A large number of companies in the EM index are Chinese state-owned enterprises (SOEs) and internet businesses with complicated ownership structures that offer foreign minority shareholders little or no legal protection. Large parts of the emerging world, where populations happen to also be growing, are underrepresented.
Figure 2 provides a breakdown, in percentage terms, of the people living in the developing world and maps this against the allocation of some of the key regions within the index.
Figure 2: Index versus population and growth
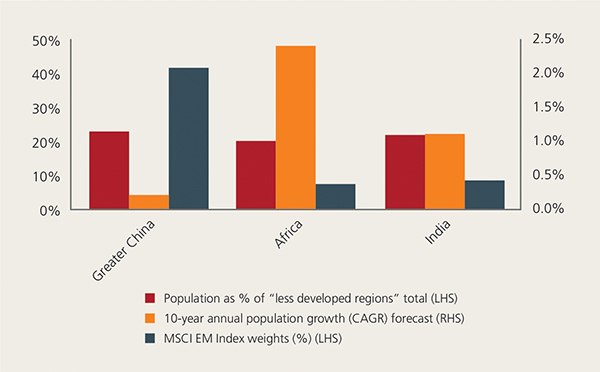
Source: Janus Henderson Investors, Factset: MSCI EM Index data as at 31 October 2017. United Nations, Department of Economic and Social Affairs, Population Division (2015), World Population Prospects: The 2015 Revision, Total Population, both sexes, using median fertility, July 2015. Regions as defined by Janus Henderson Investors. LatAm (Latin America) includes Caribbean. CAGR = compound annual growth rate (2016 – 2026 forecast).
It demonstrates that China is overrepresented in the EM index relative to its population weighting, while India and Africa are underrepresented. Importantly, Figure 2 also highlights the predicted future population change for these regions. It is clear from this that the index does not reflect where population dynamics, as well as other favourable demographic trends, are perhaps creating the potential for economic growth in the future.
In 1992 the index was backward-looking and we suspect this remains the case today. India and Africa currently seem overlooked by the benchmark. Index-based investors again appear to be following the rise of “in vogue” markets, such as China, with its debt-fuelled growth strategy. This comes at the expense of not being able to allocate capital to countries and regions that are arguably better placed to benefit from these predictable long-term demographic changes.
Over the long term, we believe that this index allocation will change. We expect active investors in the equity class to continue to benefit from seeking out long-term opportunities based on the merits of a company and where it is operating, as opposed to taking a backward-looking passive approach.
Hear no evil
The index appears to ignore the cacophony of political scandal and misallocation of capital conducted by politicians. With increasing geopolitical headwinds across the globe and immature EM legal and political systems, the need for a selective approach to investing is paramount to balancing the opportunities against significant risks. The role of the state in EM corporate ownership and its control of capital markets is significant, and we believe it has a negative impact on long-term returns. SOEs make up a substantial proportion of many emerging equity markets, which impacts the overall index. Analysis conducted by our team has identified that there is either significant state influence or direct control in more than a quarter of companies within the EM equities benchmark index, as shown in Figure 3.
Figure 3: Who controls the index?
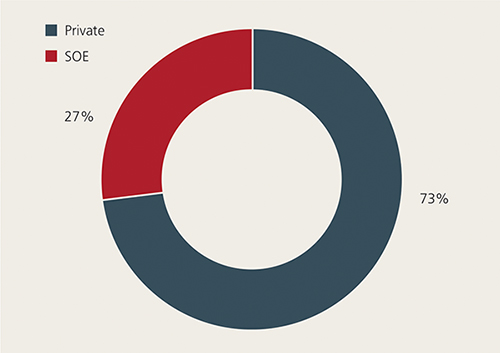
Source: MSCI, Janus Henderson Investors, as at 31 December 2016. Private, SOEs (state-owned enterprises) as defined by Janus Henderson Investors.
The importance of alignment
Many of China’s SOEs continue to follow the well-trodden path of “performing national service”. By this we mean that many Chinese corporates and SOEs invest equity capital in order to meet the geopolitical and economic needs of the State, rather than to produce a positive return for investors.
Notably, investors should be suspicious of companies where politicians are involved. Brazil’s recent recession, which was its worst on record, had its genesis in the populist and pro-cyclical lending practices of previous governments. Politicians encouraged the state-owned banks to go on a lending spree to support the economy, while well-managed private banks pulled back on loans due to increased consumer defaults and fear of weaker economic conditions.
The presence of significant political influence over or ownership of a company can also lead to poor governance. From 2003 to 2010 former President Dilma Rousseff was Chair of Petrobras, Brazil’s largest oil producer and refiner, in which the Brazilian government owns a majority stake. In an investigation known as Operation Carwash, prosecutors discovered a massive kickback and bribery scheme at the oil company, which has become Brazil’s biggest ever corruption scandal. This highlights the need for selectivity when investing in EM and the dangers of ignoring the sound of corruption and political influence.
Speak no evil
The past decade has seen a huge shift away from active management. The New York Times has reported that Vanguard, which is a global leader in passive funds, took in eight times more inflows than the rest of the US mutual fund industry combined in the last three calendar years. We believe that when investing in EM through market cycles, a very active approach (relative to the index), with an emphasis on only owning high-quality companies, can help investors meet long-term goals. That is, in our view, something to shout about.
Conclusion
Emerging markets can be a risky place for investors. Immature legal and political systems often mean inadequate levels of minority shareholder protection and economic volatility. The opportunities for investment, however, are significant and well documented. We believe that it calls for a selective approach to investing.
Passive investing within the asset class is not selective. It is not designed to filter out businesses which have poor alignment, have low return potential or which are operating in countries with a demographic headwind. The MSCI Emerging Markets Index holds 846 listed businesses in 24 countries1. It contains many companies that we feel are either too high risk or low-return businesses, which could present dangers to investors’ long-term capital growth. It is a low common-denominator approach to investing within EM, based largely on market capitalisation. We believe that it is shaped by the past and not looking to the future.
Disclaimer
This document is intended solely for the use of professionals, defined as Eligible Counterparties or Professional Clients, and is not for general public distribution. Past performance is not a guide to future performance. The value of an investment and the income from it can fall as well as rise and you may not get back the amount originally invested. Tax assumptions and reliefs depend upon an investor’s particular circumstances and may change if those circumstances or the law change. If you invest through a third party provider you are advised to consult them directly as charges, performance and terms and conditions may differ materially. Nothing in this document is intended to or should be construed as advice. This document is not a recommendation to sell or purchase any investment. It does not form part of any contract for the sale or purchase of any investment. Any investment application will be made solely on the basis of the information contained in the Prospectus (including all relevant covering documents), which will contain investment restrictions. This document is intended as a summary only and potential investors must read the prospectus, and where relevant, the key investor information document before investing. Issued in the UK by Janus Henderson Investors. Janus Henderson Investors is the name under which Janus Capital International Limited (reg no. 3594615), Henderson Global Investors Limited (reg. no. 906355), Henderson Investment Funds Limited (reg. no. 2678531), Henderson Investment Management Limited (reg. no. 1795354), AlphaGen Capital Limited (reg. no. 962757), Henderson Equity Partners Limited (reg. no.2606646), Gartmore Investment Limited (reg. no. 1508030), (each incorporated and registered in England and Wales with registered offi ce 201 Bishopsgate, London EC2M 3AE) are authorised and regulated by the Financial Conduct Authority to provide investment products and services. Telephone calls may be recorded and monitored. © 2017, Janus Henderson Investors. The name Janus Henderson Investors includes HGI Group Limited, Henderson Global Investors (Brand Management) Sarl and Janus International Holding LLC. H032425/1117
1. MSCI as at 28 February 2018
|
|
|