Maria Municchi of M&G outlines the concepts behind building sustainability into a multi-asset strategy
Pension schemes looking to deliver retirement incomes...

June 1, 2019
Report

|
Written By: Danny Nicholas |
Sometimes seemly active strategies may end up as little more than expensive index trackers. Danny Nicholas of Harris Associates outlines the importance of using strategies that are either truly active or truly passive
As we settled in to watch the most talented athletes across the globe compete in the summer Olympics, appropriately, Martijn Cremers extended his seminal Active Share work to include 32 additional countries.1 An important implication of his paper “Indexing and active fund management: International evidence” is that Active Share can now be used by practitioners as a predictor of future fund performance across world markets, consistent with the Cremers and Petajisto (2009) results for US equity mutual funds.2
With the average active equity fund underperforming and losing share to index funds, it is as if we are watching a heavyweight boxing match pitting active management against passive management.3 In his piece, Cremers officiates the boxing match by examining the consequences of indexing in the non-US equity mutual fund industry. He posits that growth in indexing certainly affects the competitive structure of mutual fund markets. But perhaps not in the way we would expect; active management may not be heading towards a knockout after all.
It turns out passive investing may not be all that bad for active management. In fact, Cremers finds that increased competition from explicit indexing benefits investors in active funds.1 Indexing forces actively managed mutual funds to increase their Active Share (deviate more from the benchmark) and to lower their fees. And active funds perform better in markets in which more low-cost indexed funds are available. Cremers reveals that the average alpha generated by active management is higher in countries in which low-cost passive alternatives are more popular, while the average alpha is lower in markets where closet indexing is more prevalent.
In countries in which investors have limited passive options, many active fund managers are effectively closet indexers. Cremers reports that nearly 20% of the worldwide mutual fund assets are managed by closet indexers.
Figure 1: Explicit and closet indexing by country of domicile as of December 2010
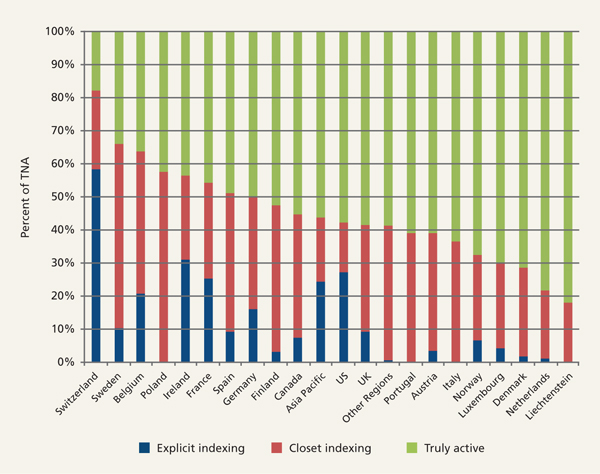
Source: Martijn Cremers, Miguel A. Ferreira, Pedro Matos, Laura Starks. “Indexing and Active Fund Management; International Evidence,” Published by The Journal of Financial Economics, February 2016.
These managers have chosen to reduce their tracking error from a benchmark as a result of a contract that is struck between asset owner and asset managers to align interests. The implicit or explicit instruction is essentially to outperform a benchmark return, subject to an annual tracking error. But as described by professors at the London School of Economics, this leads to what they call a “Curse of the Benchmarks.”4 In a simple example they illustrated how “benchmarking to market cap both fosters momentum and is gamed by it. When a security doubles in price and the investor is half-weight, the mismatch with the benchmark doubles. Underweight positions in large, risky securities have the greatest potential to cause the manager grief.”4 Picture a value manager forced to buy bubble stocks even when they know they are overpriced in order to reduce their tracking error from a momentum-driven benchmark. This not only played a part in the Tech Bubble in the late 1990s, but also the commodities boom in the mid-2000s and the Japanese equities bubble of the 1980s. By investing in a value plus momentum strategy, closet indexers have actually reduced the proportion of their portfolio that could actually outperform the benchmark. They are effectively providing beta at a high cost. When investing with these so-called active managers, investors are not getting what they have bargained for.
The conclusion of “Curse of the Benchmarks” is that “value beats both momentum and benchmarked value for medium- and long-term horizons. Only for short horizons, equivalent to the formation period of the average bubble, do momentum and benchmarked funds stand a chance of outperforming value.”4 Cremers’ “Indexing and Active Fund Management: International Evidence” quantifies these claims. He concludes that truly active funds significantly outperform closet indexers. Cremers reports that the effect of investing with conviction by increasing the Active Share of a portfolio is economically significant. A one standard deviation increase in active share is associated with an increase of about 1% per year in benchmark-adjusted returns. Truly active managers also outperform their benchmarks on average by 1.04% per year.1
Figure 2: Value versus Momentum risk-adjusted returns in the long run
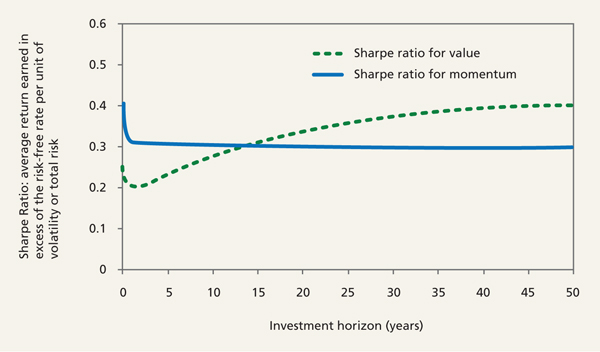
Source: Dimitri Vayanos and Paul Woolley. “Curse of the Benchmarks,” Published by The London School of Economics’ Paul Woolley Centre, Financials Markets Discussion Paper No. 747. March 2016.
In our opinion, sports are the same “zero sum games” as active management. In sports we all agree that there is some predictability of how different teams will perform. Shouldn’t concepts like talent differential, winning philosophy, team culture, team depth and investment in player development apply just as much to investment management as to sports?
It’s easy for a computer to create a basket of high P/E stocks and another of low P/E or, for that matter, high versus low on a price-to-anything metric. And it is easy to see when the premium for the “high” stocks gets large relative to history. But very few of our investments at Harris Associates and the Oakmark Funds rest solely on the idea that a currently low P/E will normalise. Value, to us, is much more complex than whether the trailing P/E ratio is above or below average.
Perhaps someday a computer algorithm will be able to decide how to normalise earnings and know which ratio best represents the intrinsic value of each company. It will be intelligent enough to know that a stock isn’t tagged “value” or “growth” based on business characteristics, but will know instead that at the right price, any company can be a value. Then, and only then, we believe a computer can construct an index of truly attractive stocks. But until that time, the portfolios we construct at Harris/Oakmark won’t be duplicated with index or ETF investments.
The asset management industry has been slow to respond to index fund competition. Active managers need to be active. Index hugging used to be an effective way to avoid underperforming enough to get fired. Of course, it also eliminated the opportunity to achieve very good performance. Today, index huggers deserve to be fired and replaced by an index fund. An investment manager has to do something that a computer can’t easily replicate, and it has to justify its fee through higher return or lower risk. If you examine the long-term records of any of our funds at Harris/Oakmark, I’m confident you’ll conclude that we are earning our fees.
But this begs the question, “What is a fair time period to judge the performance of an active manager?” The Oakmark Fund, our firm’s oldest mutual fund, incepted in August 1991. Since then, an initial investment of $10,000 has grown into almost $179,000 net of fees (as of 30 June 2016), approximately twice the level returned by the S&P 500 over that time period (about $91,000). However we realise the actual investor experience can vary widely based on the timing of initial investment. Using monthly data, we looked at the Oakmark Fund’s results for rolling time periods from one to 10 years. Just over half of the one-year periods showed underperformance, as did nearly one-third of the five-year periods. Even lengthening the time horizon to 10 years showed underperformance in over 20% of the periods. An investor who bought the fund after good performance periods and sold it after bad would have achieved miserable performance, despite the fund’s great 25-year track record. That’s why we always emphasise our philosophy and process rather than our recent returns. If the Harris/Oakmark philosophy and process are as sound as we believe they are, then periods of underperformance create an opportunity for profit. The LSE professors also came to the same conclusion: “Manager skills are best measured by comparing performance against the results of other managers committed to the value style. Over the longer term and therefore covering one or more valuation cycles, this would provide a convincing demonstration of ability and in the shorter term would help to explain underperformance against market indices when bubbles are forming. Periodic underperformance against the universe of non-value managers would be a positive sign that the fund was being run in the manner intended.”4
Contrary to what some may think, the boxing match is not a fight to the death of the active management. Rather, indexing is like a sparring partner that brings out the best in the heavyweight champion. But this increased competition will not leave all unscathed. It will force closet indexers to change the way they invest in order to make it to the next round. They must either choose to become truly active or choose to be fully passive. Indexing has removed the middle ground for these managers.
In managing assets for our clients in a truly active manner for 40 years, we believe this dynamic has positive implications for investors across the globe. We remain as convinced as ever that this patient, active approach to investment management will produce superior returns for our clients.
1. Martijn Cremers, Miguel A. Ferreira, Pedro Matos, Laura Starks. “Indexing and Active Fund Management; International Evidence,” Published by The Journal of Financial Economics, February 2016. http://papers.ssrn.com/sol3/papers.cfm?abstract_id=2558724
2. Antti Petajisto, “Active Share and Mutual Fund Performance,” Published by CFA Institute, Financial Analysts Journal. Volume 69, Number 4. 2013. http://www.petajisto.net/research.html
3. Martijn Cremers & Ankur Pareek “Patient Capital Outperformance: The Investment Skill of High Active Share Managers Who Trade Infrequently.” September 2014.
4. Dimitri Vayanos and Paul Woolley. “Curse of the Benchmarks,” Published by The London School of Economics’ Paul Woolley Centre, Financials Markets Discussion Paper No. 747. March 2016. http://www.lse.ac.uk/fmg/workingPapers/discussionPapers/fmgdps/DP747CurseoftheBenchmarks.pdf
|
|
|